Category:Climate diagrams of Germany
Jump to navigation
Jump to search
Subcategories
This category has the following 21 subcategories, out of 21 total.
Media in category "Climate diagrams of Germany"
The following 200 files are in this category, out of 544 total.
(previous page) (next page)-
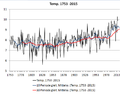
 Deutschland Temp (1750-2013).jpg 2,374 × 1,810; 1.04 MB
-
 Temperaturreihe Deutschland, Jahr, 30-10.PNG 1,104 × 740; 18 KB
-
-
 Temp.mittelwerte Deutschland 1990-2012.jpg 1,940 × 1,208; 1.27 MB
-
 Temperaturreihe Deutschland, Frühling, 30-10.PNG 1,470 × 1,017; 122 KB
-
 Temperaturreihe Deutschland, Sommer, 30-10.PNG 1,469 × 1,016; 118 KB
-
 Temperaturreihe Deutschland, Herbst, 30-10.PNG 1,469 × 1,016; 118 KB
-
 Temperaturreihe Deutschland, Winter, 30-10.PNG 1,469 × 1,016; 121 KB
-
 Blitze-je-qkm.png 1,009 × 591; 27 KB
-
 Climate-Bocholt.svg 512 × 283; 24 KB
-
 Climatechart Binz.svg 512 × 312; 24 KB
-
 DWD 02925 1987 2016.svg 800 × 600; 35 KB
-
 DWD 03404 1962 1991.svg 800 × 600; 35 KB
-
 DWD 05419 1972 2002.svg 800 × 600; 34 KB
-
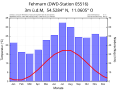
 DWD List auf Sylt 1945 10020.svg 720 × 540; 112 KB
-
 DWD List auf Sylt 1946 10020.svg 720 × 540; 108 KB
-
 DWD List auf Sylt 1947 10020.svg 720 × 540; 110 KB
-
 DWD Würzburg 1901 10655.svg 720 × 540; 110 KB
-
 DWD Würzburg 1902 10655.svg 720 × 540; 111 KB
-
 DWD Würzburg 1903 10655.svg 720 × 540; 112 KB
-
 DWD Würzburg 1904 10655.svg 720 × 540; 111 KB
-
 DWD Würzburg 1905 10655.svg 720 × 540; 111 KB
-
 DWD Würzburg 1906 10655.svg 720 × 540; 112 KB
-
 DWD Würzburg 1907 10655.svg 720 × 540; 111 KB
-
 DWD Würzburg 1908 10655.svg 720 × 540; 112 KB
-
 DWD Würzburg 1909 10655.svg 720 × 540; 110 KB
-
 DWD Würzburg 1910 10655.svg 720 × 540; 110 KB
-
 DWD Würzburg 1911 10655.svg 720 × 540; 109 KB
-
 DWD Würzburg 1912 10655.svg 720 × 540; 110 KB
-
 DWD Würzburg 1913 10655.svg 720 × 540; 111 KB
-
 DWD Würzburg 1914 10655.svg 720 × 540; 109 KB
-
 DWD Würzburg 1915 10655.svg 720 × 540; 110 KB
-
 DWD Würzburg 1916 10655.svg 720 × 540; 111 KB
-
 DWD Würzburg 1917 10655.svg 720 × 540; 109 KB
-
 DWD Würzburg 1918 10655.svg 720 × 540; 111 KB
-
 DWD Würzburg 1919 10655.svg 720 × 540; 109 KB
-
 DWD Würzburg 1920 10655.svg 720 × 540; 111 KB
-
 DWD Würzburg 1921 10655.svg 720 × 540; 110 KB
-
 DWD Würzburg 1922 10655.svg 720 × 540; 110 KB
-
 DWD Würzburg 1923 10655.svg 720 × 540; 112 KB
-
 DWD Würzburg 1924 10655.svg 720 × 540; 110 KB
-
 DWD Würzburg 1925 10655.svg 720 × 540; 111 KB
-
 DWD Würzburg 1926 10655.svg 720 × 540; 112 KB
-
 DWD Würzburg 1927 10655.svg 720 × 540; 111 KB
-
 DWD Würzburg 1928 10655.svg 720 × 540; 112 KB
-
 DWD Würzburg 1929 10655.svg 720 × 540; 110 KB
-
 DWD Würzburg 1930 10655.svg 720 × 540; 112 KB
-
 DWD Würzburg 1931 10655.svg 720 × 540; 111 KB
-
 DWD Würzburg 1932 10655.svg 720 × 540; 112 KB
-
 DWD Würzburg 1933 10655.svg 720 × 540; 111 KB
-
 DWD Würzburg 1934 10655.svg 720 × 540; 111 KB
-
 DWD Würzburg 1935 10655.svg 720 × 540; 112 KB
-
 DWD Würzburg 1936 10655.svg 720 × 540; 112 KB
-
 DWD Würzburg 1937 10655.svg 720 × 540; 111 KB
-
 DWD Würzburg 1938 10655.svg 720 × 540; 113 KB
-
 DWD Würzburg 1939 10655.svg 720 × 540; 111 KB
-
 DWD Würzburg 1940 10655.svg 720 × 540; 111 KB
-
 DWD Würzburg 1941 10655.svg 720 × 540; 109 KB
-
 DWD Würzburg 1942 10655.svg 720 × 540; 110 KB
-
 DWD Würzburg 1943 10655.svg 720 × 540; 111 KB
-
 DWD Würzburg 1944 10655.svg 720 × 540; 109 KB
-
 DWD Würzburg 1945 10655.svg 720 × 540; 110 KB
-
 DWD Würzburg 1946 10655.svg 720 × 540; 113 KB
-
 Falk Oberdorf Jahrestemperaturen Deutschland 1753-2015.png 930 × 734; 75 KB
-
 Falk Oberdorf Jahrestemperaturen Deutschland 1753-20152.png 1,226 × 938; 109 KB
-
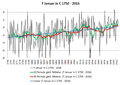 Falk Oberdorf Januartemperaturen Deutschland 1750-2016.png 1,240 × 874; 124 KB
-
 Falk Oberdorf Julitemperaturen Deutschland 1750-2015.png 1,238 × 896; 120 KB
-
 German temperature timeseries 1881 2020.png 1,860 × 1,046; 93 KB
-
 Germany-TAVG-Trend 1743-2013.svg 1,024 × 640; 466 KB
-
 Klima Weißenfels.svg 512 × 283; 35 KB
-
 Klima-arid-humid Infografik.png 1,465 × 823; 173 KB
-
 Klima-Samos.svg 1,140 × 236; 17 KB
-
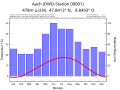 Klimadiagramm Aach DWD 00001 Jahre 1956-1986.svg 800 × 600; 30 KB
-
 Klimadiagramm Aachen DWD 00003 Jahre 1981-2011.svg 800 × 600; 35 KB
-
 Klimadiagramm Aldersbach-Kriestorf DWD 00073 Jahre 1985-2015.svg 800 × 600; 30 KB
-
 Klimadiagramm Alfhausen DWD 00078 Jahre 1987-2016.svg 800 × 600; 34 KB
-
 Klimadiagramm Altglashütte DWD 00132 Jahre 1957-1987.svg 800 × 600; 30 KB
-
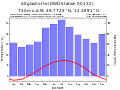
 Klimadiagramm Altomünster-Maisbrunn DWD 00142 Jahre 1985-2015.svg 800 × 600; 31 KB
-
 Klimadiagramm Alzey DWD 00150 Jahre 1957-1987.svg 800 × 600; 31 KB
-
 Klimadiagramm Amberg-Unterammersricht DWD 00151 Jahre 1987-2016.svg 800 × 600; 28 KB
-
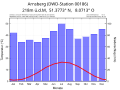
 Klimadiagramm Angermünde DWD 00164 Jahre 1987-2016.svg 800 × 600; 34 KB
-
 Klimadiagramm Annaberg-Buchholz DWD 00169 Jahre 1917-1946.svg 800 × 600; 30 KB
-
 Klimadiagramm Ansbach DWD 00175 Jahre 1921-1951.svg 800 × 600; 35 KB
-
 Klimadiagramm Arkona DWD 00183 Jahre 1987-2016.svg 800 × 600; 32 KB
-
 Klimadiagramm Arnsberg DWD 00186 Jahre 1968-1998.svg 800 × 600; 30 KB
-
 Klimadiagramm Arolsen-Neu Berich DWD 00193 Jahre 1938-1938.svg 800 × 600; 35 KB
-
 Klimadiagramm Artern DWD 00198 Jahre 1987-2016.svg 800 × 600; 34 KB
-
 Klimadiagramm Attenkam DWD 00217 Jahre 1987-2016.svg 800 × 600; 34 KB
-
 Klimadiagramm Augsburg (Sankt Stephan) DWD 00231 Jahre 1944-1974.svg 800 × 600; 31 KB
-
 Klimadiagramm Augsburg DWD 00232 Jahre 1987-2016.svg 800 × 600; 30 KB
-
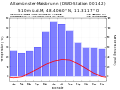
 Klimadiagramm Aulendorf-Haslach DWD 07135 Jahre 1975-2004.svg 800 × 600; 31 KB
-
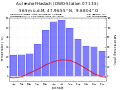
 Klimadiagramm Aurich DWD 00243 Jahre 1977-2006.svg 800 × 600; 35 KB
-
 Klimadiagramm Baden-Baden-Geroldsau DWD 00257 Jahre 1986-2016.svg 800 × 600; 31 KB
-
 Klimadiagramm Bamberg (Sternwarte) DWD 00284 Jahre 1928-1958.svg 800 × 600; 35 KB
-
 Klimadiagramm Bamberg DWD 00282 Jahre 1987-2016.svg 800 × 600; 35 KB
-
 Klimadiagramm Bederkesa DWD 00327 Jahre 1966-1996.svg 800 × 600; 30 KB
-
 Klimadiagramm Beerfelden DWD 00330 Jahre 1982-2012.svg 800 × 600; 30 KB
-
 Klimadiagramm Bensheim DWD 00355 Jahre 1959-1989.svg 800 × 600; 35 KB
-
 Klimadiagramm Berchtesgaden (KKst) DWD 00361 Jahre 1917-1947.svg 800 × 600; 29 KB
-
 Klimadiagramm Berge DWD 05825 Jahre 1961-1991.svg 800 × 600; 32 KB
-
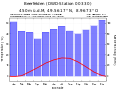
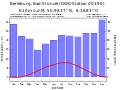
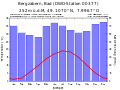 Klimadiagramm Bergzabern, Bad DWD 00377 Jahre 1978-2008.svg 800 × 600; 34 KB
-
 Klimadiagramm Berleburg, Bad-Stünzel DWD 00390 Jahre 1987-2016.svg 800 × 600; 31 KB
-
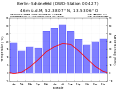
 Klimadiagramm Berlin-Buch DWD 00400 Jahre 1966-1996.svg 800 × 600; 34 KB
-
 Klimadiagramm Berlin-Dahlem (FU) DWD 00403 Jahre 1987-2016.svg 800 × 600; 32 KB
-
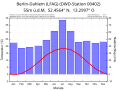 Klimadiagramm Berlin-Dahlem (LFAG) DWD 00402 Jahre 1915-1945.svg 800 × 600; 35 KB
-
 Klimadiagramm Berlin-Schönefeld DWD 00427 Jahre 1987-2016.svg 800 × 600; 34 KB
-
 Klimadiagramm Berlin-Tegel DWD 00430 Jahre 1987-2016.svg 800 × 600; 32 KB
-
 Klimadiagramm Berlin-Tempelhof DWD 00433 Jahre 1987-2016.svg 800 × 600; 32 KB
-
 Klimadiagramm Berlin-Zehlendorf DWD 00435 Jahre 1977-2006.svg 800 × 600; 34 KB
-
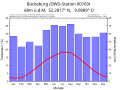
 Klimadiagramm Bernburg Saale (Nord) DWD 00445 Jahre 1987-2016.svg 800 × 600; 32 KB
-
 Klimadiagramm Bernkastel-Kues DWD 00450 Jahre 1976-2006.svg 800 × 600; 34 KB
-
 Klimadiagramm Berus DWD 00460 Jahre 1976-2006.svg 800 × 600; 35 KB
-
 Klimadiagramm Biedenkopf-Wallau DWD 00480 Jahre 1977-2006.svg 800 × 600; 30 KB
-
 Klimadiagramm Birx Rhön DWD 01411 Jahre 1896-1926.svg 800 × 600; 30 KB
-
 Klimadiagramm Bischbrunn DWD 00502 Jahre 1977-2006.svg 800 × 600; 30 KB
-
 Klimadiagramm Blankenrath DWD 00535 Jahre 1978-2008.svg 800 × 600; 34 KB
-
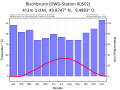
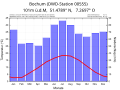 Klimadiagramm Bochum DWD 00555 Jahre 1931-1961.svg 800 × 600; 35 KB
-
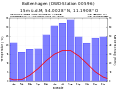
 Klimadiagramm Boizenburg DWD 00591 Jahre 1962-1992.svg 800 × 600; 34 KB
-
 Klimadiagramm Boltenhagen DWD 00596 Jahre 1985-2015.svg 800 × 600; 32 KB
-
 Klimadiagramm Bonn-Friesdorf DWD 00599 Jahre 1957-1986.svg 800 × 600; 34 KB
-
 Klimadiagramm Borkum-Süderstraße DWD 00619 Jahre 1948-1977.svg 800 × 600; 34 KB
-
 Klimadiagramm Brande-Hörnerkirchen DWD 00648 Jahre 1977-2006.svg 800 × 600; 35 KB
-
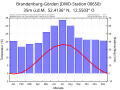 Klimadiagramm Brandenburg-Görden DWD 00650 Jahre 1961-1990.svg 800 × 600; 34 KB
-
 Klimadiagramm Braunlage DWD 00656 Jahre 1975-2005.svg 800 × 600; 32 KB
-
 Klimadiagramm Braunschweig (T.H.) DWD 00661 Jahre 1894-1924.svg 800 × 600; 35 KB
-
 Klimadiagramm Braunschweig DWD 00662 Jahre 1987-2016.svg 800 × 600; 32 KB
-
 Klimadiagramm Bremen DWD 00691 Jahre 1987-2016.svg 800 × 600; 34 KB
-
 Klimadiagramm Bremerhaven DWD 00701 Jahre 1986-2016.svg 800 × 600; 35 KB
-
 Klimadiagramm Bremervörde (A) DWD 00703 Jahre 1955-1985.svg 800 × 600; 35 KB
-
 Klimadiagramm Brilon DWD 00717 Jahre 1946-1946.svg 800 × 600; 30 KB
-
 Klimadiagramm Brocken DWD 00722 Jahre 1987-2016.svg 800 × 600; 35 KB
-

-
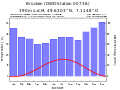 Klimadiagramm Brücken DWD 00736 Jahre 1964-1994.svg 800 × 600; 30 KB
-

-
 Klimadiagramm Burgwald-Bottendorf DWD 00817 Jahre 1975-2005.svg 800 × 600; 35 KB
-
 Klimadiagramm Bückeburg DWD 00769 Jahre 1979-2009.svg 800 × 600; 34 KB
-
 Klimadiagramm Bühlertal DWD 00772 Jahre 1956-1986.svg 800 × 600; 32 KB
-
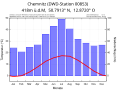 Klimadiagramm Chemnitz DWD 00853 Jahre 1987-2016.svg 800 × 600; 30 KB
-
 Klimadiagramm Clausthal-Zellerfeld DWD 00863 Jahre 1981-2011.svg 800 × 600; 32 KB
-
 Klimadiagramm Cottbus DWD 00880 Jahre 1984-2014.svg 800 × 600; 35 KB
-

-
 Klimadiagramm Cuxhaven DWD 00891 Jahre 1987-2016.svg 800 × 600; 35 KB
-

-
-
 Klimadiagramm Deuselbach DWD 00953 Jahre 1976-2006.svg 800 × 600; 35 KB
-
 Klimadiagramm Diepholz DWD 00963 Jahre 1964-1994.svg 800 × 600; 34 KB
-
 Klimadiagramm Dillenburg DWD 00979 Jahre 1953-1983.svg 800 × 600; 35 KB
-
 Klimadiagramm Dillingen Donau DWD 00982 Jahre 1976-2006.svg 800 × 600; 30 KB
-
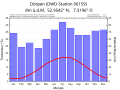
 Klimadiagramm Dippoldiswalde-Reinberg DWD 00991 Jahre 1961-1991.svg 800 × 600; 30 KB
-
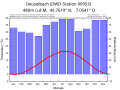
 Klimadiagramm Doberlug-Kirchhain DWD 01001 Jahre 1962-1992.svg 800 × 600; 34 KB
-
 Klimadiagramm Donaueschingen DWD 01018 Jahre 1966-1996.svg 800 × 600; 28 KB
-
 Klimadiagramm Dortmund DWD 01032 Jahre 1917-1946.svg 800 × 600; 35 KB
-
 Klimadiagramm Dresden (Mitte) DWD 01047 Jahre 1885-1915.svg 800 × 600; 30 KB
-
 Klimadiagramm Dresden-Hosterwitz DWD 01050 Jahre 1972-2002.svg 800 × 600; 35 KB
-
 Klimadiagramm Dresden-Klotzsche DWD 01048 Jahre 1987-2016.svg 800 × 600; 28 KB
-
 Klimadiagramm Duisburg-Laar DWD 01087 Jahre 1951-1981.svg 800 × 600; 35 KB
-
 Klimadiagramm Dörpen DWD 06159 Jahre 1978-2008.svg 800 × 600; 35 KB
-
 Klimadiagramm Düsseldorf DWD 01078 Jahre 1987-2016.svg 800 × 600; 34 KB
-
 Klimadiagramm Düsseldorf-Südfriedhof DWD 01079 Jahre 1966-1996.svg 800 × 600; 34 KB
-
 Klimadiagramm Eberbach (LUBW) DWD 01093 Jahre 1975-2005.svg 800 × 600; 31 KB
-
 Klimadiagramm Ebrach DWD 01107 Jahre 1984-2014.svg 800 × 600; 28 KB
-
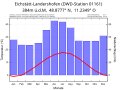 Klimadiagramm Eichstätt-Landershofen DWD 01161 Jahre 1975-2005.svg 800 × 600; 28 KB
-
 Klimadiagramm Einbeck DWD 01172 Jahre 1959-1989.svg 800 × 600; 34 KB
-
 Klimadiagramm Ellwangen-Rindelbach DWD 01197 Jahre 1987-2016.svg 800 × 600; 28 KB
-
 Klimadiagramm Elsdorf Erftkreis DWD 01201 Jahre 1971-2000.svg 800 × 600; 34 KB
-
 Klimadiagramm Elsfleth DWD 01204 Jahre 1935-1965.svg 800 × 600; 35 KB
-
 Klimadiagramm Emden-Nesserland DWD 01219 Jahre 1944-1974.svg 800 × 600; 35 KB
-
 Klimadiagramm Ems, Bad DWD 01229 Jahre 1967-1997.svg 800 × 600; 35 KB
-
 Klimadiagramm Engelskirchen DWD 01238 Jahre 1966-1996.svg 800 × 600; 32 KB
-
 Klimadiagramm Eppingen DWD 01254 Jahre 1972-2002.svg 800 × 600; 34 KB
-
 Klimadiagramm Erfde DWD 01266 Jahre 1982-2012.svg 800 × 600; 35 KB
-
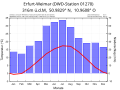 Klimadiagramm Erfurt-Weimar DWD 01270 Jahre 1987-2016.svg 800 × 600; 34 KB
-
 Klimadiagramm Eschenbach Oberpfalz DWD 01292 Jahre 1976-2006.svg 800 × 600; 35 KB
-
 Klimadiagramm Eschwege DWD 01297 Jahre 1960-1990.svg 800 × 600; 34 KB
-
 Klimadiagramm Eslohe DWD 01300 Jahre 1974-2004.svg 800 × 600; 31 KB
-
 Klimadiagramm Essen-Bredeney DWD 01303 Jahre 1971-2001.svg 800 × 600; 30 KB
-
 Klimadiagramm Eutin DWD 01329 Jahre 1974-2003.svg 800 × 600; 34 KB
-
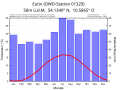
 Klimadiagramm Fehmarn DWD 05516 Jahre 1966-1996.svg 800 × 600; 32 KB
-
 Klimadiagramm Feldberg Schwarzwald DWD 01346 Jahre 1985-2015.svg 800 × 600; 35 KB
-
 Klimadiagramm Fichtelberg DWD 01358 Jahre 1987-2016.svg 800 × 600; 32 KB
-

-
 Klimadiagramm Flensburg (Schäferhaus) DWD 01379 Jahre 1955-1985.svg 800 × 600; 30 KB
-
-
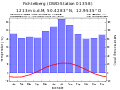
 Klimadiagramm Frankfurt Main DWD 01420 Jahre 1987-2016.svg 800 × 600; 32 KB
-
 Klimadiagramm Frankfurt Oder DWD 01426 Jahre 1955-1984.svg 800 × 600; 35 KB
-
 Klimadiagramm Freiberg DWD 01441 Jahre 1922-1952.svg 800 × 600; 30 KB
-
 Klimadiagramm Freiburg DWD 01443 Jahre 1975-2005.svg 800 × 600; 30 KB
-
 Klimadiagramm Freiburg Elbe DWD 01451 Jahre 1987-2016.svg 800 × 600; 30 KB
-

-
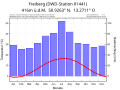
 Klimadiagramm Freudenstadt DWD 01468 Jahre 1974-2004.svg 800 × 600; 28 KB
-
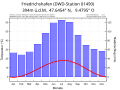 Klimadiagramm Friedrichshafen DWD 01490 Jahre 1950-1980.svg 800 × 600; 31 KB
-
 Klimadiagramm Friesoythe-Altenoythe DWD 01503 Jahre 1978-2008.svg 800 × 600; 35 KB
-
 Klimadiagramm Fulda-Horas DWD 01526 Jahre 1975-2005.svg 800 × 600; 35 KB
-
 Klimadiagramm Gardelegen DWD 01544 Jahre 1963-1993.svg 800 × 600; 32 KB
-
 Klimadiagramm Garmisch-Partenkirchen DWD 01550 Jahre 1975-2005.svg 800 × 600; 28 KB
-
 Klimadiagramm Geisenheim DWD 01580 Jahre 1984-2014.svg 800 × 600; 31 KB
-
 Klimadiagramm Geldern-Walbeck DWD 01590 Jahre 1987-2016.svg 800 × 600; 34 KB
-
 Klimadiagramm Genthin DWD 01605 Jahre 1965-1995.svg 800 × 600; 32 KB
-
 Klimadiagramm Gernsheim DWD 01619 Jahre 1976-2005.svg 800 × 600; 34 KB
-
 Klimadiagramm Gießen (Lahntal) DWD 01638 Jahre 1954-1984.svg 800 × 600; 34 KB
.jpg)


_DWD_00231_Jahre_1944-1974.svg)


_DWD_00284_Jahre_1928-1958.svg)


_DWD_00361_Jahre_1917-1947.svg)


_DWD_00403_Jahre_1987-2016.svg)
_DWD_00402_Jahre_1915-1945.svg)


_DWD_00445_Jahre_1987-2016.svg)


_DWD_00661_Jahre_1894-1924.svg)


_DWD_00703_Jahre_1955-1985.svg)


_DWD_01047_Jahre_1885-1915.svg)


_DWD_01093_Jahre_1975-2005.svg)


_DWD_01379_Jahre_1955-1985.svg)
_DWD_01425_Jahre_1915-1945.svg)


_DWD_01638_Jahre_1954-1984.svg)