User talk:Cmglee/archive2019
| 2O11 | 2O12 | 2O13 | 2O14 | 2O15 | 2O16 | 2O17 | 2O18 | 2O19 | 2O2O |
| 2O21 | 2O22 | 2O23 | 2O24 | ||||||
Planetary Elevation Models[edit]
Hi There,
I love the work you have done so far with the planetary elevation models so far, particularly Mars. Unfortunately the Wikipedia page for downloading the STL seems broken. Would it be possible for you to upload it to a separate file-sharing website for us to download?
(As a note on this, what program did you use to create it/can you change the height scale (currently at 20x) easily?) — Preceding unsigned comment was added by 62.252.189.68 (talk) 19:49, 7 January 2019 (UTC)
- Thanks! It seems to be working for me. Note that each is over 20 MB, so it might take a while to download. Another way to view them is by clicking the viewstl button e.g.
View https://upload.wikimedia.org/wikipedia/commons/c/cd/Mars_elevation.stl on viewstl.com
- I wrote a Python 2 script using PyPNG to create the STL from a heightmap in PNG format. Here is the source code. By changing the variables at the top of the script and the heightmap, one can tweak the model. The one you asked about is exaggeration. The script is described at en:user:cmglee#Mars_elevation.stl_☎_1_May_2018. Do give it a go!
- Cheers, cmɢʟee ⋅τaʟκ 00:50, 9 January 2019 (UTC)
Thank you very much for linking the code! I have got it up and running, however struggling to track down a suitable image to use. Do you have a link available to the image that you ended up using, or any guidelines for what sort of image works best? From the code I have seen that they need to be 1-channel equirectangular, but what about colour/BW?
EDIT: The link is unavailable (I assume due to the current government shutdown in the US). Is there a way to for you to upload the image you saved to use? — Preceding unsigned comment was added by 54.37.18.131 (talk) 19:55, 11 January 2019 (UTC)
Thanks again — Preceding unsigned comment was added by 54.37.18.131 (talk) 19:51, 11 January 2019 (UTC)
- Hello! Here's an archive of it in JPEG format. Convert it to an 8-bit greyscale PNG and feed it into my script. There's a higher-quality TIFF version, but it fails to download from http://astrogeology.usgs.gov/search/details/Mars/GlobalSurveyor/MOLA/Mars_MGS_MOLA_DEM_mosaic_global_463m . If you want to use your own heightmaps, they must be full-planet equirectangular 8-bit greyscale PNGs with dark being low elevations. The variables at the top of the script determine the scale and spheroid eccentricity. http://google.com/images?q=heightmap+filetype:png has some you can try. Good luck! cmɢʟee ⋅τaʟκ 14:04, 18 January 2019 (UTC)
Hi. Currently all thumbnails in a {{Svg lang}} template just link to the SVG file, which is quite redundant. I'd prefer having a link to the corresponding ?lang=xyz page on Commons. Would you mind, if I changed {{Source thumb}} accordingly? Is {{Source thumb}} used anywhere outside of {{Svg lang}}? Thanks. TilmannR (talk) 19:46, 3 March 2019 (UTC)
- Good idea, TilmannR; please go ahead. It's used in many derived images to show the original image, but if the default has the same behaviour, there should be no problem. Cheers, cmɢʟee ⋅τaʟκ 00:04, 4 March 2019 (UTC)
- Oops, I don't think I got notified of your reply ({{Ping}} seems more reliable than {{U}} for this purpose), so I went ahead and created my own Template:Lang gallery, which has the disadvantage of having smaller thumbnails, but looks exactly like any other <gallery>, which is nice. (E.g. File:Bobo_doll.svg#Summary)
- Regarding "the default has the same behaviour": Do you mean "the default has the same behaviour as the non-default" or "the default has the same behaviour as before"? Currently it links to the Commons page, but I can make it link to the raw file, if you want. TilmannR (talk) 10:20, 5 March 2019 (UTC)
- And I have a small question. I don't have much experience with template development, so I don't know where I can look this up: If you have a template A within a template B on a file page F, does
{{PAGENAME}}evaluate to the name of B or F? The first version of {{Lang gallery}} didn't work (the {{Lang gallery/thumb}} were invisible) and passing{{{file|{{PAGENAME}}}}}to {{Lang gallery/thumb}} fixed it. On the other hand, if the file name had simply been invalid, I would have expected the thumbnail to be a redlink and not invisible. Not sure how to debug this. TilmannR (talk) 10:32, 5 March 2019 (UTC) Never mind. The actual problem was that I tried to pass an empty first parameter, which automatically turned the second parameter into the first parameter and made the second parameter empty, which made the template invisible.TilmannR (talk) 10:54, 5 March 2019 (UTC)- Never mind. The actual actual problem was, that
{{{1|default value}}}doesn't yield the default value, when 1 is empty, but not undefined. I really should have read meta:Help:Template before writing that template. TilmannR (talk) 20:47, 5 March 2019 (UTC)- Hi @TilmannR: , sorry for the slow reply. Template:Lang_gallery looks great! Re Do you mean "the default has the same behaviour as the non-default" or "the default has the same behaviour as before"?, I meant the latter. I'm happy to have your new template replace my old one, if you like. Cheers, cmɢʟee ⋅τaʟκ 18:33, 18 March 2019 (UTC)
- Oh, weird: I didn't get alerted about the ping either. Also your "thanks" are linking to the specific edit, for which you thanked me, so I completely missed your reply. I changed {{Source thumb}} to link to the raw file, when no language is specified. Makes sense: There are still links to the file page and its #filelinks section, so no functionality got lost. I actually came here to talk about mars elevation... TilmannR (talk) 12:27, 24 March 2019 (UTC)
- Hi @TilmannR: , sorry for the slow reply. Template:Lang_gallery looks great! Re Do you mean "the default has the same behaviour as the non-default" or "the default has the same behaviour as before"?, I meant the latter. I'm happy to have your new template replace my old one, if you like. Cheers, cmɢʟee ⋅τaʟκ 18:33, 18 March 2019 (UTC)
Mars elevation STLs[edit]
 This section has been moved to User_talk:TilmannR#Mars_elevation_STLs — TilmannR (talk) 21:35, 26 March 2019 (UTC)
P.S.: I don't have time to do this right now, but {{Viewstl}} should have an optional parameter for passing a file name instead of a complete URL. TilmannR (talk) 13:18, 24 March 2019 (UTC)
![]() Done TilmannR (talk) 18:45, 24 March 2019 (UTC)
Done TilmannR (talk) 18:45, 24 March 2019 (UTC)
- Excellent – thank you very much! cmɢʟee ⋅τaʟκ 13:32, 26 March 2019 (UTC)
Animated SVG Templates[edit]
@user:cmglee: For VideoWiki,we are planning on building animated SVG Templates, so that once we build a template, let's say bar charts, simple circle percentages, etc- a normal Wikipedian user can then just input the text variable and use that animated SVG in any of the slides of a video he or she is building. For Eg: Dengue Fever - if we have an animated svg bar chart that shows no. of days it can be showed on the "Recovery" slide, severe dengue slide, etc. Would love your advise/ and help if you are interested. The goal is to work hard once (make a template once) in such a way that the animated svgs can be used multiple times across any video by an average Wikipedian user. -
Ian Furst created an amazing "Medical Symptoms Template" that can be used across several medical videos such as Dengue, Malaria, Arthritis as the necessary symptoms can be marked as "visible/hidden" depending upon the disease. -Pratik.pks (talk) 00:23, 27 May 2019 (UTC)
- I have no idea if possible, but if there is a way to pass text items to the svg it would be ideal. But I can't figure out a way to do it. E.g. the "Head" label could read "headache" or "unconscious". Would appreciate any input. Ian Furst (talk) 11:59, 27 May 2019 (UTC)
- Hi @Pratik.pks: and @Ian Furst: , thanks for your message. It's a great idea to have SVGs easily generated by editors and I'd love to contribute to the effort. Is it possible to embed SVG files directly in a Wiki page, though? I don't know of a way to pass text into an SVG. The best workarounds I know of are:
- Using a specialised extension, e.g. en:Template:Graph,_chart_and_plot_templates and en:Wikipedia:EasyTimeline
- Hacking the systemLanguage property, e.g. File:Tallest_towers_in_the_world.svg – according to commons:Translation_possible/Learn_more#Language_codes, there are 443 codes, so can support all combinations of only 8 "visible/hidden" options, and would make the file unnecessarily large
- Generating an SVG file for the user to upload, e.g. @Slashme: 's Parliament diagram tool
- Generating an SVG offline e.g. en:user:cmglee/Dynamic_SVG_for_Wikimedia_projects#GIF_animation_to_SVG_converter – likely too difficult for the average editor
- Perhaps one method (that requires an external webserver) is to have image tags which refer to an external URL. The webserver can then dynamically render or return an image matching the referrer. This might work only if the reader views the SVG and not the thumbnail.
- I don't quite understand the purpose of the animation of the "Medical Symptoms Template" – all it seems to do on my browser is to fade in.
- Cheers, cmɢʟee ⋅τaʟκ 22:00, 28 May 2019 (UTC)
- Thanks cmglee, the upload svg is here. It's less about the animations, and more about the user being able to quickly create a standardized diagram for (in this case) symptoms. The svg code has a bunch of <g>roupings. One for each label, overlaid on the body silhouette. The logic, is that a user can quickly make each label group visible/hidden, or change the label name. Right now, a new diagram has be be created for each set of symptoms, for each language (give or take). With this, it can be quickly edited in a text editor, for a new svg. In an ideal world, the user would enter a simple template text, calling the file, like {{File:symptoms_man|viewbox;torso|head;hidden|chest;visible;angina|...}} for each symptoms. Thoughts? Wrt to the fade-in, given that commons won't even support the simple fade animation I'm thinking I should remove that. Ian Furst (talk) 10:59, 30 May 2019 (UTC)
- Thanks @Ian Furst: I see what you mean now. Considering the limitations of SVG on Wikimedia (no Javascript), may I suggest an alternative solution: make it up from parts e.g. en:Template:Football_kit. Even better, since the main differences are the labels, you can use en:Template:Superimpose2, en:Template:Annotated_image_4 etc to position markers and labels over a blank image, similar to en:Template:Location_map+ but for anatomy. The drawback is that the compositing is done by the viewer's browser, but hopefully it's recent/compatible enough to render it correctly. You could make a wrapper template to do the positioning for the editor; I can help you with this if you like. Will that work? cmɢʟee ⋅τaʟκ 12:44, 30 May 2019 (UTC)
- I think so. I've been surfing around today reading about templates (I tripped across a map with the overlay), and saw some of your 2016 discussions from phabricator. As I understand it, all CSS is essentially scrubbed? One of the issues is turning a label on or off (I use the hidden/visible parameter in the code, with all defaulted to visible). I'm a novice with templates, so let me take a day or two to educate myself and will ping back. Why don't they allow some CSS controls of svg's? What is the security issue? Ian Furst (talk) 21:17, 30 May 2019 (UTC)
- Hi @Ian Furst, I've created en:template:symptoms_man. An example of its use is en:user:cmglee/Symptoms_man. The table is merely to not take up too much vertical space. Feel free to change them.
- CSS is fine but files with Javascript are rejected. If I remember correctly, the danger is that web browsers give media on a webpage the same privileges as other files from the same webserver, including the page itself. If Javascript is allowed, malicious users can embed a script in an SVG to e.g. steal readers' cookies (by reading and sending them to their own server) and can then impersonate the readers or at least find out what articles they've read, or display a fake login page. I've asked Wikimedia developers to filter uploaded Javascript to allow benign uses, but it's too easy to miss dangerous uses. An example of a clever attack is to load in an invisible frame a webpage with links to controversial topics, then check with Javascript the colours of the links (web browsers traditionally coloured visited links purple) to deduce what opinions or interests readers' have. More at http://theregister.co.uk/2018/10/31/web_browsers_privacy/
- By the way, your image has markers for "Nausea" and "Fever" on the chest. Is that correct? Cheers, cmɢʟee ⋅τaʟκ 12:40, 31 May 2019 (UTC)
- To see how I thought the template could be used, see the dengue videowiki, press the "preview my changes". In this case, I've imported it to aftereffects, but it would be so much easier (and more versitile) if the HTML/CSS version could be shown in Wikipedia. If doesn't see to want to show a preview of the svg. I don't have any .js in it, I'm not sure why it won't show the preview. Ian Furst (talk) 18:57, 31 May 2019 (UTC)
- The fever and nausea are just placeholders. Can be subbed in for anything. Ian Furst (talk) 19:26, 31 May 2019 (UTC)
- @Ian Furst: Right, now I see what you wanted the template for. I suppose you can take screenshots of my template with the relevant symptoms turned on. If After Effects requires SVGs directly, perhaps the best methods are to manually edit the file's CSS as you had done, or automate the process either online (as in the Parliament diagram tool) or offline (using Python etc). I'll retain the template in case another editor has any use for it on Wiki articles. Cheers, cmɢʟee ⋅τaʟκ 11:36, 3 June 2019 (UTC)
- P.S. I couldn't fix the SVG thumbnail so have posted this help request. Please monitor the page. Ta!
- I think so. I've been surfing around today reading about templates (I tripped across a map with the overlay), and saw some of your 2016 discussions from phabricator. As I understand it, all CSS is essentially scrubbed? One of the issues is turning a label on or off (I use the hidden/visible parameter in the code, with all defaulted to visible). I'm a novice with templates, so let me take a day or two to educate myself and will ping back. Why don't they allow some CSS controls of svg's? What is the security issue? Ian Furst (talk) 21:17, 30 May 2019 (UTC)
- Thanks @Ian Furst: I see what you mean now. Considering the limitations of SVG on Wikimedia (no Javascript), may I suggest an alternative solution: make it up from parts e.g. en:Template:Football_kit. Even better, since the main differences are the labels, you can use en:Template:Superimpose2, en:Template:Annotated_image_4 etc to position markers and labels over a blank image, similar to en:Template:Location_map+ but for anatomy. The drawback is that the compositing is done by the viewer's browser, but hopefully it's recent/compatible enough to render it correctly. You could make a wrapper template to do the positioning for the editor; I can help you with this if you like. Will that work? cmɢʟee ⋅τaʟκ 12:44, 30 May 2019 (UTC)
- Thanks cmglee, the upload svg is here. It's less about the animations, and more about the user being able to quickly create a standardized diagram for (in this case) symptoms. The svg code has a bunch of <g>roupings. One for each label, overlaid on the body silhouette. The logic, is that a user can quickly make each label group visible/hidden, or change the label name. Right now, a new diagram has be be created for each set of symptoms, for each language (give or take). With this, it can be quickly edited in a text editor, for a new svg. In an ideal world, the user would enter a simple template text, calling the file, like {{File:symptoms_man|viewbox;torso|head;hidden|chest;visible;angina|...}} for each symptoms. Thoughts? Wrt to the fade-in, given that commons won't even support the simple fade animation I'm thinking I should remove that. Ian Furst (talk) 10:59, 30 May 2019 (UTC)
File:Comparison US standard atmosphere 1962[edit]
I had a look at the density scale in the graph which indicates a density of at least 1.03 kN/m2 at 0 altitude (at one pixel above the 0 line) whereas the measured pressure is 1.01 kN/m2.
GregKaye (talk) 08:39, 5 June 2019 (UTC)
- Thanks, @GregKaye: . The graphs were traced from the image at http://www.centennialofflight.net/essay/Theories_of_Flight/atmosphere/TH1G1.jpg which credited to NASA and also gives the value at around 1.03 kN/m². Unfortunately, I can no longer find reference to the graph on a more reliable source now. I'm a little reluctant to update it for just this value, as it will possibly then make other values wrong. If you know of better data for the 1962 US standard atmosphere, I'll be happy to redraw the whole thing. Cheers, cmɢʟee ⋅τaʟκ 13:37, 11 June 2019 (UTC)
Template to add labels[edit]
Hey Cmglee, I just finished a different svg (for electric vehicles), and I'm starting to better understand everything you've been talking about wrt a simple template to add in labels. In an ideal world, the labels from a template would be imported to the svg script but I'm not sure how that's possible without .js. en:Template:Annotated_image_4 seems the best solution, although it's an inelegant solution. I'll be at Wikimania, and was going to bring it up there. Can you help me refine the ask? "I'dd like to make a template, similar to Annotated_image_4, that can a text string be brought into an svg to use as a label rather than just overlaying it" Possible avenue is embedding the svg within the html object? I know nothing of html. Ian Furst (talk) 12:04, 17 June 2019 (UTC)
- Hey @Ian Furst: , hope you don't mind my starting a new section as indentation of the previous one was getting unwieldy. Very nice illustration you've made – just curious why Battery has two w:leader lines. If there are two batteries, wouldn't Regenerative brake also have them? Great idea to bring it up at Wikimania. I plan to be there, so can give you my support. The good news is that it's in the SVG 1.2 standard (see http://www.w3.org/TR/SVGTiny12/struct.html#SwitchElement) and has been implemented in the case of systemLanguage. Still, we'll have to justify why it's worth adding it and find someone able and willing to implement it (I haven't a clue!) I think embedding SVG in HTML is out of the question, as the SVG can possibly modify the page outside its bounds. In 2016, I brought up displaying it in the w:Wikipedia:Media_Viewer on http://phabricator.wikimedia.org/T138665 but it's in the backlog. If you're motivated to push it through, I'll be most grateful! Cheers, cmɢʟee ⋅τaʟκ 00:52, 23 June 2019 (UTC)

|
File:Maddison GDP per capita 1500-1950.svg has been listed at Commons:Deletion requests so that the community can discuss whether it should be kept or not. We would appreciate it if you could go to voice your opinion about this at its entry.
If you created this file, please note that the fact that it has been proposed for deletion does not necessarily mean that we do not value your kind contribution. It simply means that one person believes that there is some specific problem with it, such as a copyright issue. Please see Commons:But it's my own work! for a guide on how to address these issues. |
Laviaread78b (talk) 14:39, 3 July 2019 (UTC)
Adding temperature too[edit]
I'd like to know whether the temperature can be added to the graphic
https://commons.wikimedia.org/wiki/File:Hours_of_daylight_vs_latitude_vs_day_of_year_cmglee.svg
--Backinstadiums (talk) 10:55, 11 July 2019 (UTC)
- Likely not, Backinstadiums, as different parts of the world at the same latitude have different temperatures at different times. For example, Marseille and Vladivostok are both at 43°N, but have vastly different climates! cmɢʟee ⋅τaʟκ 11:25, 11 July 2019 (UTC)
A barnstar for you![edit]

|
The Original Barnstar |
| Thanks for the graphics Backinstadiums (talk) 10:55, 11 July 2019 (UTC) |
Thank you very much, Backinstadiums. Much appreciated! cmɢʟee ⋅τaʟκ 11:09, 11 July 2019 (UTC)
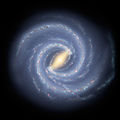
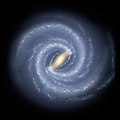
Hi! The galaxy map File:Milky Way Arms ssc2008-10.svg credits File:Milky_Way_2005.jpg as the source for the embedded galaxy image. However, on inspection it would appear instead to be a later version, File:Milky_Way_2008.jpg. There are also two more recent versions, but it doesn't appear to be either of those (and of course the 2013 image wasn't around in 2011 when you first made this map!):
-
 The map with the embedded image
 -
 The 2005 image; all later versions have fewer arms
 -
 The 2008 image; I'm pretty sure this is what's in the map
 -
 The 2010 image; it adds an extra arm crossing over others
 -
 The 2013 image; it drops the crossing arm and reduces the size of the bulge


I'm pretty confident of this (I pulled apart the SVG and compared the embedded image to all four versions—the map is rotated 180° compared to the last three, at least), but I didn't want to change your stated attribution without checking with you first. But could you have a look and then, if necessary, update the attribution? -- Perey (talk) 09:52, 14 July 2019 (UTC)
- Hi @Perey: . Looking at the file history of the 2005 version, it seems that Ashill's upload of 4 June 2008 was reverted on 19 April 2014. The SVG's source is the Ashill version. I'm unsure how to update the attribution, as it was correct at the time of creation. Cheers, cmɢʟee ⋅τaʟκ 12:29, 14 July 2019 (UTC)
- Huh. Quite right—not sure how I missed that! As the revert comment notes, the new image (the Ashill version) is what became File:Milky_Way_2008.jpg. So I guess updating the attribution would work... but leaving it as-is would also make sense. (See, I knew asking here first would be the right thing!)
- Alternatively, maybe the whole issue would be avoided if the SVG were updated to use the artist's latest version... ;-) -- Perey (talk) 14:50, 14 July 2019 (UTC)
 Done As its track record shows that it's liable to change, perhaps the JPEG version should follow a consistent naming scheme which includes its date? cmɢʟee ⋅τaʟκ 17:12, 14 July 2019 (UTC)
Wallis product improperly labeled?[edit]
I think the Wallis product is the blue square markers, not the purple asterisks. The Wallis product alternatively estimates above and below the value of pi/2 as it converges to the value. — Preceding unsigned comment added by To9g3qa (talk • contribs) 02:35, 21 August 2019 (UTC)
- Thanks for bringing it to my attention. There are two possible expansions of the Wallis product:
- and
- Using the former, the product oscillates around . The latter groups two terms at a time (note that a • a(a - 1)(a + 1) = a²a² - 1), and does not. I'll make it clearer on the Wikipedia article. Cheers, cmɢʟee ⋅τaʟκ 12:09, 4 September 2019 (UTC)


Symmetrical set Venn diagram[edit]
Wow! It's amazing how you made Symmetrical 5-set Venn diagram ! May I ask you how you obtained it and if it's possible to use this how-to in order to make Symmetrical set Venn diagram with more than 5 sets, please. It would be very kind. 92.188.54.144 17:43, 24 August 2019 (UTC)
- Thanks! It was originally designed by mathematician Branko Grünbaum. I wrote the Python program at http://commons.wikimedia.org/wiki/File:Symmetrical_5-set_Venn_diagram.svg#Summary to make the smallest regions as large as possible. Let me know if you've other questions. Cheers, cmɢʟee ⋅τaʟκ 15:09, 25 August 2019 (UTC)
May I ask you if there is a way to obtain a 6-or-more by using a software ? Note : it's me the former called "92.188.54.144 17:43, 24 August 2019 (UTC)". My IP provider changes my ip adress any time.2A01:CB0C:38C:9F00:31CD:9270:5879:5FE6 16:41, 2 September 2019 (UTC)
I don't know if a way to do that, but know of the above 6-set Venn diagram made of only triangles, devised by Jeremy J Carroll ( http://www.hpl.hp.com/techreports/2000/HPL-2000-73.pdf ). In the SVG, Hover over a set to highlight it, and click it to select and deselect it.
6-set Venn diagram SMIL.svg - Would it help to register an account so that you can have a permanent customisable identity? You needn't use your real name if you prefer not to. Cheers, cmɢʟee ⋅τaʟκ 00:18, 3 September 2019 (UTC)

I fact, I prefer ellipses. Furthermore, in this figure there are areas far too small.2A01:CB0C:38C:9F00:31CD:9270:5879:5FE6 00:25, 3 September 2019 (UTC)
- Me too. Sadly, I don't know of a way to generate them analytically. Would you like to post your question at en: Wikipedia:Reference_desk/Mathematics? Someone there may be able to answer it. Cheers, cmɢʟee ⋅τaʟκ 08:49, 4 September 2019 (UTC)
|
|
File:Fourier series sawtooth wave circle animation.svg has been listed at Commons:Deletion requests so that the community can discuss whether it should be kept or not. We would appreciate it if you could go to voice your opinion about this at its entry.
If you created this file, please note that the fact that it has been proposed for deletion does not necessarily mean that we do not value your kind contribution. It simply means that one person believes that there is some specific problem with it, such as a copyright issue. Please see Commons:But it's my own work! for a guide on how to address these issues. |
Bob K (talk) 12:33, 25 August 2019 (UTC)
September 2019: it's Wiki Loves Monuments time again![edit]
Hi
You're receiving this message because you've previously contributed to the annual Wiki Loves Monuments contest in the UK. We'd be delighted if you would do so again this year and help record our local built environment for future generations.
You can find more details at the Wiki Loves Monuments UK website. Or, if you have images taken in other countries, you can check the international options. This year's contest runs until 30 September 2019.
Many thanks for your help once more! MichaelMaggs (talk) 15:34, 3 September 2019 (UTC)
Collaboration on a Sunburst_peripheral_drift_illusion demo?[edit]

I have made the observation on your https://commons.wikimedia.org/wiki/File:Sunburst_peripheral_drift_illusion.svg that if you fixate the centre, the colour almost immediately disappears. I would like to publish this effect with your collaboration as a co-author.
I have mocked up a version of the figure that exemplifies this new effect:
Please email me at cwtyler2020@gmail.com for full details. — Preceding unsigned comment added by Cwtyler (talk • contribs) 18:32, 4 September 2019 (UTC)


- Thanks, @Cwtyler: That's kind of you! It was actually a serendipitous discovery. I had intended it to be the image on the left, but wasn't knowledgeable enough about SVG at the time, and the thumbnail didn't quite match the rendering on my web browser. Do you see the same effect on the new version? Cheers, cmɢʟee ⋅τaʟκ 20:48, 5 September 2019 (UTC)
Yes, indeed, that new version looks more controlled and gives stronger peripheral motion effects, so it is optimal for your purposes. However, it is less successful for the color suppression effect that I am interested in, Are you willing to provide me with a file of only the color component of the older image? Many thanks in advance, if so. — Preceding unsigned comment added by Cwtyler (talk • contribs) 21:44, 5 September 2019 (UTC)
- Hi @Cwtyler: I've uploaded just the colour channels of the old version. Is that what you wanted? Cheers, cmɢʟee ⋅τaʟκ 13:17, 8 September 2019 (UTC)
Sum of Three Cubes[edit]
Just discovered:

Can you update File:Sum_of_3_cubes.svg? –Gus Polly (talk) 16:05, 6 September 2019 (UTC)
- Done Thanks, @Gus Polly: cmɢʟee ⋅τaʟκ 13:13, 8 September 2019 (UTC)
Community Insights Survey[edit]
Share your experience in this survey
Hi Cmglee/archive2019,
The Wikimedia Foundation is asking for your feedback in a survey about your experience with Wikimedia Commons and Wikimedia. The purpose of this survey is to learn how well the Foundation is supporting your work on wiki and how we can change or improve things in the future. The opinions you share will directly affect the current and future work of the Wikimedia Foundation.
Please take 15 to 25 minutes to give your feedback through this survey. It is available in various languages.
This survey is hosted by a third-party and governed by this privacy statement (in English).
Find more information about this project. Email us if you have any questions, or if you don't want to receive future messages about taking this survey.
Sincerely,
RMaung (WMF) 01:14, 10 September 2019 (UTC)
Reminder: Community Insights Survey[edit]
Share your experience in this survey
Hi Cmglee/archive2019,
A couple of weeks ago, we invited you to take the Community Insights Survey. It is the Wikimedia Foundation’s annual survey of our global communities. We want to learn how well we support your work on wiki. We are 10% towards our goal for participation. If you have not already taken the survey, you can help us reach our goal! Your voice matters to us.
Please take 15 to 25 minutes to give your feedback through this survey. It is available in various languages.
This survey is hosted by a third-party and governed by this privacy statement (in English).
Find more information about this project. Email us if you have any questions, or if you don't want to receive future messages about taking this survey.
Sincerely,
RMaung (WMF) 15:24, 20 September 2019 (UTC)
Adding my note of thanks. Your Comparison of highest mountains as displayed on the w:Seven Summits article (found while randomly chasing links from today's "Google Doodle") is really ingenious, and thanks for making that and all your other info-graphic productions. --Buck 17:26, 22 September 2019 (UTC) — Preceding unsigned comment was added by 71.163.166.229 (talk) 17:29, 22 September 2019 (UTC)
- Many thanks for your kind words. I'm glad you find it useful and am encouraged to make more when I get feedback like yours! cmɢʟee ⋅τaʟκ 00:52, 24 September 2019 (UTC)
Reminder: Community Insights Survey[edit]
Share your experience in this survey
Hi Cmglee/archive2019,
There are only a few weeks left to take the Community Insights Survey! We are 30% towards our goal for participation. If you have not already taken the survey, you can help us reach our goal! With this poll, the Wikimedia Foundation gathers feedback on how well we support your work on wiki. It only takes 15-25 minutes to complete, and it has a direct impact on the support we provide.
Please take 15 to 25 minutes to give your feedback through this survey. It is available in various languages.
This survey is hosted by a third-party and governed by this privacy statement (in English).
Find more information about this project. Email us if you have any questions, or if you don't want to receive future messages about taking this survey.
Sincerely,
RMaung (WMF) 20:04, 3 October 2019 (UTC)
Hi Cmglee, I have rendered your nice image series again. I think uploading the images separately is a better choice than bundling them in a file like this. It gives the user more freedom. In this case e.g. the freedom to show only every second picture. And also that to add captions. The usability of {{Imagestack}} is not what it could be, but I find it ok, and it may still improve. I would like to know if you have an opinion on how these cuts should be enumerated. It seems obvious to me, that the hexagon should be 0, and that corresponding cuts like this and that should differ only in their sign. But I have no opinion on what the values should be. Actually I think 3 to -3 (or rather -26/9) would make sense. Watchduck (quack) 02:50, 12 October 2019 (UTC)
- Hi, @Watchduck: It's amazing what you've managed to do with Imagestack and my 3D model. I didn't know about the template; thanks for telling me. I like your splitting the frames into odd and even ones. Showing just one set may give the user the incorrect impression e.g. for the even ones, that any section has hexagrams.
- Re the numbering, I like your expressing the position as a fraction with 0 being the central slice, but prefer ±1 as the first and last (a blank frame) frames rather than ±3, as [-1, 1] seems more natural than [-3, 3].
- I also find the colour a bit dark, which interferes with discernment of the smaller hexagrams of the section, which is why I changed the colours to #ff9, #cc9 and #999. Do you think they could be lightened?
- Thanks,
cmɢʟee ⋅τaʟκ 12:57, 16 October 2019 (UTC)


- I think this orange-brown tone looks nice, and the contrast with black is just fine. I am not a fan of the lighter original color, which I would describe as grayish neon-yellow. If I were you, I would compare the two versions on different monitors, and ask some other people which one they like better. Or maybe you could first upload a test version, just for tinkering with the colors. As long as you don't overwrite my 2000px renderings with smaller ones, I don't really care.
- Initially I also thought: When in doubt, use [1, -1]. But with 3 corresponding to the full view the half-edge truncation corresponds to 2 and full-edge truncation to 1. Let's not forget that this is the 3-dimensional cube. The equivalent for the square would be [2, -2] and for the tesseract [4, -4]. This actually does seem more natural to me. Watchduck (quack) 19:49, 16 October 2019 (UTC)
- OK, guess our tastes differ, but I'm happy to keep it as is. Good point about the dimensionality. Cheers, cmɢʟee ⋅τaʟκ 15:22, 26 October 2019 (UTC)
Ultima Thule ---> Arrokoth.[edit]
https://commons.wikimedia.org/wiki/File:Interstellar_probes_trajectory.svg
Ultima Thule has been officially named Arrokoth. See the Wikipedia page on it. Дрейгорич (talk) 01:41, 13 November 2019 (UTC)
- Thanks for telling me, @Дрейгорич: I'll update it. Cheers, cmɢʟee ⋅τaʟκ 00:28, 17 November 2019 (UTC)
| 2O11 | 2O12 | 2O13 | 2O14 | 2O15 | 2O16 | 2O17 | 2O18 | 2O19 | 2O2O |
| 2O21 | 2O22 | 2O23 | 2O24 | ||||||