File:WHO Covid 2020 Jan-Aug daily c confirmed,deaths32.pdf
Jump to navigation
Jump to search

Size of this JPG preview of this PDF file: 800 × 473 pixels. Other resolutions: 320 × 189 pixels | 640 × 378 pixels | 1,024 × 605 pixels | 1,280 × 756 pixels | 3,300 × 1,950 pixels.
Original file (3,300 × 1,950 pixels, file size: 18 KB, MIME type: application/pdf)
Captions
Captions
Add a one-line explanation of what this file represents
Summary[edit]
| Description |
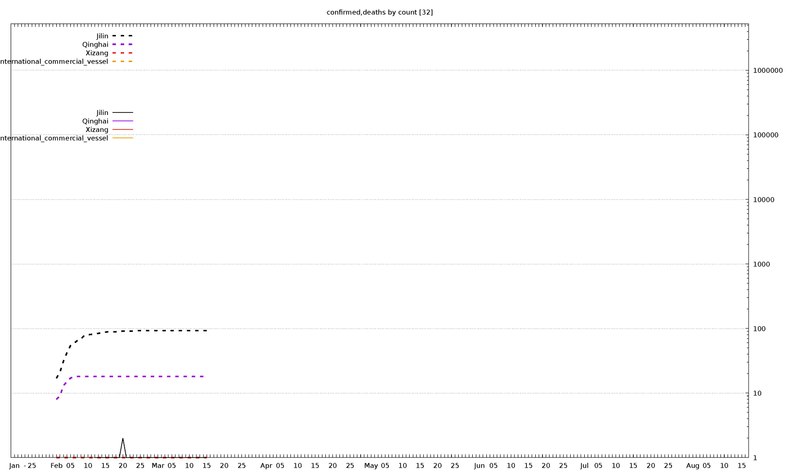
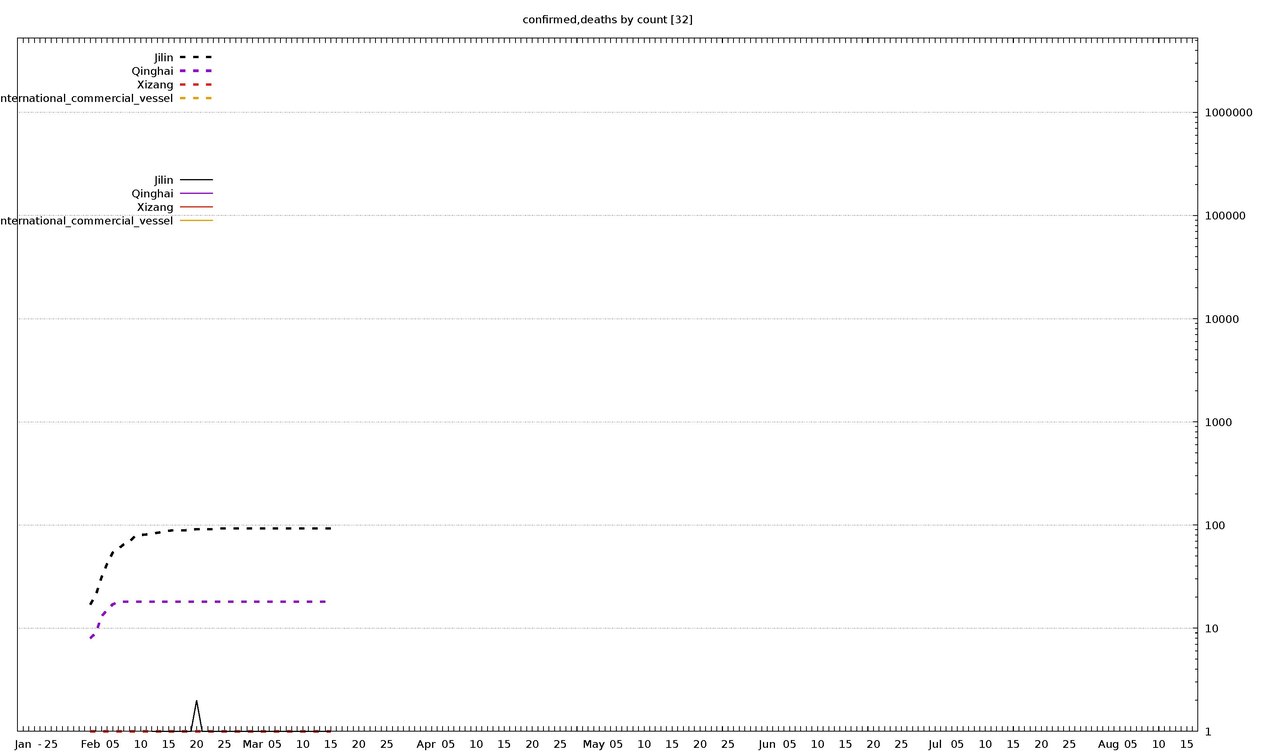
English: Visualization of "Total Confirmed Cases" (thick dashed lines) and "Total Deaths" (thin solid lines) figures from the available WHO COVID-19 daily situation reports (20 Jan - 16 Aug 2020). Countries are ordered descendingly by number of "Total Confirmed Cases" on 16 Aug 2020. The visualization is split into diagrams of 8 countries each, since gnuplot (in batch mode) does not support more distinct colors; all diagrams share the same scale. The vertical axis has logarithmic scale. The horizontal axis starts on 20 Jan 2020 (situation report 1) and ends on 16 Aug 2020 (situation report 209).
For an overview of all related visualizations, and a more detailled description, see WHO Covid diagram set#Available cumulated diagrams Jan-Aug 2020 (daily). |
| Date | |
| Source | Own work |
| Author | Jochen Burghardt |
Licensing[edit]
I, the copyright holder of this work, hereby publish it under the following license:
This file is licensed under the Creative Commons Attribution-Share Alike 4.0 International license.
- You are free:
- to share – to copy, distribute and transmit the work
- to remix – to adapt the work
- Under the following conditions:
- attribution – You must give appropriate credit, provide a link to the license, and indicate if changes were made. You may do so in any reasonable manner, but not in any way that suggests the licensor endorses you or your use.
- share alike – If you remix, transform, or build upon the material, you must distribute your contributions under the same or compatible license as the original.
Gnuplot source code[edit]
| Gnuplot source code |
|---|
set term pdf size 22,13
set term pdf font "sans,20"
set output "WHO_Covid_c_confirmed,deaths32.pdf"
set key autotitle columnhead
set termoption noenhanced

set xrange [-1:210]
set logscale y
set logscale y2
set yrange [1:5258565]
set y2range [1:5258565]
set grid y2tics
unset ytics
set xtics 3650,100
set y2tics
set format y2 "%.0f"

set title "confirmed,deaths by count [32]"

$data <<EOF
rep	day	Jilin	Qinghai	Xizang	International_commercial_vessel	Jilin	Qinghai	Xizang	International_commercial_vessel
1	Jan	.	.	.	.	.	.	.	.
2	""	.	.	.	.	.	.	.	.
3	""	.	.	.	.	.	.	.	.
-	-	-	-	-	-	-	-	-	-
4	""	.	.	.	.	.	.	.	.
5	25	.	.	.	.	.	.	.	.
6	""	.	.	.	.	.	.	.	.
7	""	.	.	.	.	.	.	.	.
8	""	.	.	.	.	.	.	.	.
9	""	.	.	.	.	.	.	.	.
10	""	.	.	.	.	.	.	.	.
11	""	.	.	.	.	.	.	.	.
12	Feb	17	8	1	.	.	.	.	.
13	""	21	9	1	.	.	.	.	.
14	""	31	13	1	.	.	.	.	.
15	""	42	15	1	.	.	.	.	.
16	05	54	17	1	.	.	.	.	.
17	""	59	18	1	.	.	.	.	.
18	""	65	18	1	.	.	.	.	.
19	""	69	18	1	.	.	.	.	.
20	""	78	18	1	.	.	.	.	.
21	10	80	18	1	.	.	.	.	.
22	""	81	18	1	.	.	.	.	.
23	""	83	18	1	.	1	0.00001	0.00001	.
24	""	84	18	1	.	.	.	.	.
25	""	86	18	1	.	1	0.00001	0.00001	.
26	15	88	18	1	.	1	0.00001	0.00001	.
27	""	89	18	1	.	1	0.00001	0.00001	.
28	""	89	18	1	.	1	0.00001	0.00001	.
29	""	89	18	1	.	1	0.00001	0.00001	.
30	""	90	18	1	.	1	0.00001	0.00001	.
31	20	91	18	1	.	2	0.00001	0.00001	.
32	""	91	18	1	.	1	0.00001	0.00001	.
33	""	91	18	1	.	1	0.00001	0.00001	.
34	""	91	18	1	.	1	0.00001	0.00001	.
35	""	93	18	1	.	1	0.00001	0.00001	.
36	25	93	18	1	.	1	0.00001	0.00001	.
37	""	93	18	1	.	1	0.00001	0.00001	.
38	""	93	18	1	.	1	0.00001	0.00001	.
39	""	93	18	1	.	1	0.00001	0.00001	.
40	""	93	18	1	.	1	0.00001	0.00001	.
41	Mar	93	18	1	.	1	0.00001	0.00001	.
42	""	93	18	1	.	1	0.00001	0.00001	.
43	""	93	18	1	.	1	0.00001	0.00001	.
44	""	93	18	1	.	1	0.00001	0.00001	.
45	05	93	18	1	.	1	0.00001	0.00001	.
46	""	93	18	1	.	1	0.00001	0.00001	.
47	""	93	18	1	.	1	0.00001	0.00001	.
48	""	93	18	1	.	1	0.00001	0.00001	.
49	""	93	18	1	.	1	0.00001	0.00001	.
50	10	93	18	1	.	1	0.00001	0.00001	.
51	""	93	18	1	.	1	0.00001	0.00001	.
52	""	93	18	1	.	1	0.00001	0.00001	.
53	""	93	18	1	.	1	0.00001	0.00001	.
54	""	93	18	1	.	1	0.00001	0.00001	.
55	15	93	18	1	.	1	0.00001	0.00001	.
56	""	.	.	.	.	.	.	.	.
57	""	.	.	.	.	.	.	.	.
58	""	.	.	.	.	.	.	.	.
59	""	.	.	.	.	.	.	.	.
60	20	.	.	.	.	.	.	.	.
61	""	.	.	.	.	.	.	.	.
62	""	.	.	.	.	.	.	.	.
63	""	.	.	.	.	.	.	.	.
64	""	.	.	.	.	.	.	.	.
65	25	.	.	.	.	.	.	.	.
66	""	.	.	.	.	.	.	.	.
67	""	.	.	.	.	.	.	.	.
68	""	.	.	.	.	.	.	.	.
69	""	.	.	.	.	.	.	.	.
70	""	.	.	.	.	.	.	.	.
71	""	.	.	.	.	.	.	.	.
72	Apr	.	.	.	.	.	.	.	.
73	""	.	.	.	.	.	.	.	.
74	""	.	.	.	.	.	.	.	.
75	""	.	.	.	.	.	.	.	.
76	05	.	.	.	.	.	.	.	.
77	""	.	.	.	.	.	.	.	.
78	""	.	.	.	.	.	.	.	.
79	""	.	.	.	.	.	.	.	.
80	""	.	.	.	.	.	.	.	.
81	10	.	.	.	.	.	.	.	.
82	""	.	.	.	.	.	.	.	.
83	""	.	.	.	.	.	.	.	.
84	""	.	.	.	.	.	.	.	.
85	""	.	.	.	.	.	.	.	.
86	15	.	.	.	.	.	.	.	.
87	""	.	.	.	.	.	.	.	.
88	""	.	.	.	.	.	.	.	.
89	""	.	.	.	.	.	.	.	.
90	""	.	.	.	.	.	.	.	.
91	20	.	.	.	.	.	.	.	.
92	""	.	.	.	.	.	.	.	.
93	""	.	.	.	.	.	.	.	.
94	""	.	.	.	.	.	.	.	.
95	""	.	.	.	.	.	.	.	.
96	25	.	.	.	.	.	.	.	.
97	""	.	.	.	.	.	.	.	.
98	""	.	.	.	.	.	.	.	.
99	""	.	.	.	.	.	.	.	.
100	""	.	.	.	.	.	.	.	.
101	""	.	.	.	.	.	.	.	.
102	May	.	.	.	.	.	.	.	.
103	""	.	.	.	.	.	.	.	.
104	""	.	.	.	.	.	.	.	.
105	""	.	.	.	.	.	.	.	.
106	05	.	.	.	.	.	.	.	.
107	""	.	.	.	.	.	.	.	.
108	""	.	.	.	.	.	.	.	.
109	""	.	.	.	.	.	.	.	.
110	""	.	.	.	.	.	.	.	.
111	10	.	.	.	.	.	.	.	.
112	""	.	.	.	.	.	.	.	.
113	""	.	.	.	.	.	.	.	.
114	""	.	.	.	.	.	.	.	.
115	""	.	.	.	.	.	.	.	.
116	15	.	.	.	.	.	.	.	.
117	""	.	.	.	.	.	.	.	.
118	""	.	.	.	.	.	.	.	.
119	""	.	.	.	.	.	.	.	.
120	""	.	.	.	.	.	.	.	.
121	20	.	.	.	.	.	.	.	.
122	""	.	.	.	.	.	.	.	.
123	""	.	.	.	.	.	.	.	.
124	""	.	.	.	.	.	.	.	.
125	""	.	.	.	.	.	.	.	.
126	25	.	.	.	.	.	.	.	.
127	""	.	.	.	29	.	.	.	0.00001
128	""	.	.	.	.	.	.	.	.
129	""	.	.	.	.	.	.	.	.
130	""	.	.	.	.	.	.	.	.
131	""	.	.	.	.	.	.	.	.
132	""	.	.	.	.	.	.	.	.
133	Jun	.	.	.	.	.	.	.	.
134	""	.	.	.	.	.	.	.	.
135	""	.	.	.	.	.	.	.	.
136	""	.	.	.	.	.	.	.	.
137	05	.	.	.	.	.	.	.	.
138	""	.	.	.	.	.	.	.	.
139	""	.	.	.	.	.	.	.	.
140	""	.	.	.	.	.	.	.	.
141	""	.	.	.	.	.	.	.	.
142	10	.	.	.	.	.	.	.	.
143	""	.	.	.	.	.	.	.	.
144	""	.	.	.	.	.	.	.	.
145	""	.	.	.	.	.	.	.	.
146	""	.	.	.	.	.	.	.	.
147	15	.	.	.	.	.	.	.	.
148	""	.	.	.	.	.	.	.	.
149	""	.	.	.	.	.	.	.	.
150	""	.	.	.	.	.	.	.	.
151	""	.	.	.	.	.	.	.	.
152	20	.	.	.	.	.	.	.	.
153	""	.	.	.	.	.	.	.	.
154	""	.	.	.	.	.	.	.	.
155	""	.	.	.	.	.	.	.	.
156	""	.	.	.	.	.	.	.	.
157	25	.	.	.	.	.	.	.	.
158	""	.	.	.	.	.	.	.	.
159	""	.	.	.	.	.	.	.	.
160	""	.	.	.	.	.	.	.	.
161	""	.	.	.	.	.	.	.	.
162	""	.	.	.	.	.	.	.	.
163	Jul	.	.	.	.	.	.	.	.
164	""	.	.	.	.	.	.	.	.
165	""	.	.	.	.	.	.	.	.
166	""	.	.	.	.	.	.	.	.
167	05	.	.	.	.	.	.	.	.
168	""	.	.	.	.	.	.	.	.
169	""	.	.	.	.	.	.	.	.
170	""	.	.	.	.	.	.	.	.
171	""	.	.	.	.	.	.	.	.
172	10	.	.	.	.	.	.	.	.
173	""	.	.	.	.	.	.	.	.
174	""	.	.	.	.	.	.	.	.
175	""	.	.	.	.	.	.	.	.
176	""	.	.	.	.	.	.	.	.
177	15	.	.	.	.	.	.	.	.
178	""	.	.	.	.	.	.	.	.
179	""	.	.	.	.	.	.	.	.
180	""	.	.	.	.	.	.	.	.
181	""	.	.	.	.	.	.	.	.
182	20	.	.	.	.	.	.	.	.
183	""	.	.	.	.	.	.	.	.
184	""	.	.	.	.	.	.	.	.
185	""	.	.	.	.	.	.	.	.
186	""	.	.	.	.	.	.	.	.
187	25	.	.	.	.	.	.	.	.
188	""	.	.	.	.	.	.	.	.
189	""	.	.	.	.	.	.	.	.
190	""	.	.	.	.	.	.	.	.
191	""	.	.	.	.	.	.	.	.
192	""	.	.	.	.	.	.	.	.
193	""	.	.	.	.	.	.	.	.
194	Aug	.	.	.	.	.	.	.	.
195	""	.	.	.	.	.	.	.	.
196	""	.	.	.	.	.	.	.	.
197	""	.	.	.	.	.	.	.	.
198	05	.	.	.	.	.	.	.	.
199	""	.	.	.	.	.	.	.	.
200	""	.	.	.	.	.	.	.	.
201	""	.	.	.	.	.	.	.	.
202	""	.	.	.	.	.	.	.	.
203	10	.	.	.	.	.	.	.	.
204	""	.	.	.	.	.	.	.	.
205	""	.	.	.	.	.	.	.	.
206	""	.	.	.	.	.	.	.	.
207	""	.	.	.	.	.	.	.	.
208	15	.	.	.	.	.	.	.	.
209	""	.	.	.	.	.	.	.	.
EOF

set multiplot
# plot field 'confirmed'
  plot $data using 0:3  with lines lc 8 lw 5 dt 2 title at 0.135, 0.925
replot $data using 0:4  with lines lc 1 lw 5 dt 2 title at 0.135, 0.907
replot $data using 0:5  with lines lc 7 lw 5 dt 2 title at 0.135, 0.889
replot $data using 0:6  with lines lc 4 lw 5 dt 2 title at 0.135, 0.871

# plot field 'deaths'
replot $data using 0:7  with lines lc 8 lw 2 title at 0.135, 0.763
replot $data using 0:8  with lines lc 1 lw 2 title at 0.135, 0.745
replot $data using 0:9  with lines lc 7 lw 2 title at 0.135, 0.727
replot $data using 0:10 with lines lc 4 lw 2 title at 0.135, 0.709

# plot hor axis calendar
replot $data using 0:(1):xticlabel(2) with lines
|
File history
Click on a date/time to view the file as it appeared at that time.
| Date/Time | Thumbnail | Dimensions | User | Comment | |
|---|---|---|---|---|---|
| current | 11:52, 25 September 2020 |  | 3,300 × 1,950 (18 KB) | Jochen Burghardt (talk | contribs) | =={{int:filedesc}}== {{Information |description={{en|1=Visualization of ''"Total Confirmed Cases"'' (thick dashed lines) and ''"Total Deaths"'' (thin solid lines) from the available WHO COVID-19 daily [https://www.who.int/emergencies/diseases/novel-coronavirus-2019/situation-reports situation reports] (20 Jan - 16 Aug 2020); see File:WHO Covid 2020 Jan-Aug daily c confirmed,deaths01.pdf for details.}} |date=2020-09-24 |s... |
You cannot overwrite this file.
File usage on Commons
There are no pages that use this file.