File:WHO Covid 2020 Jan-Aug daily C Zimbabwe.pdf
Jump to navigation
Jump to search

Size of this JPG preview of this PDF file: 800 × 473 pixels. Other resolutions: 320 × 189 pixels | 640 × 378 pixels | 1,024 × 605 pixels | 1,280 × 756 pixels | 3,300 × 1,950 pixels.
Original file (3,300 × 1,950 pixels, file size: 22 KB, MIME type: application/pdf)
Captions
Captions
Add a one-line explanation of what this file represents
Summary[edit]
| Description |
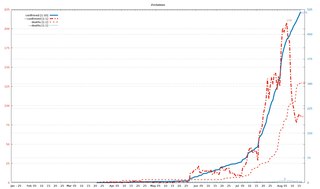
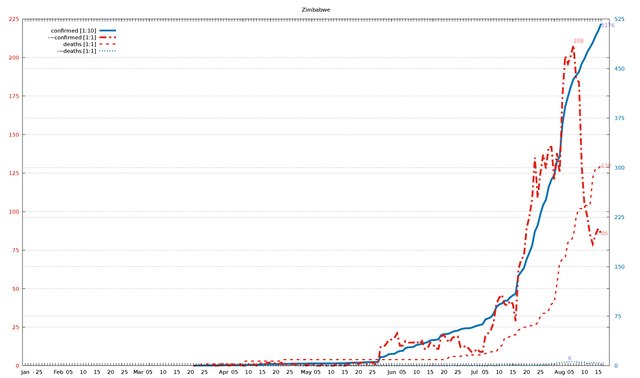
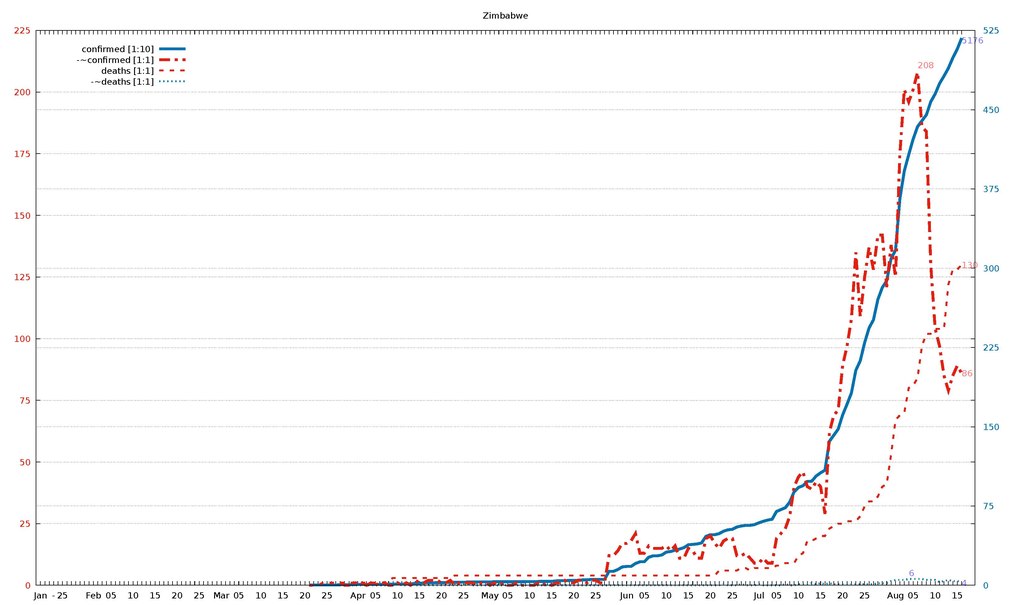
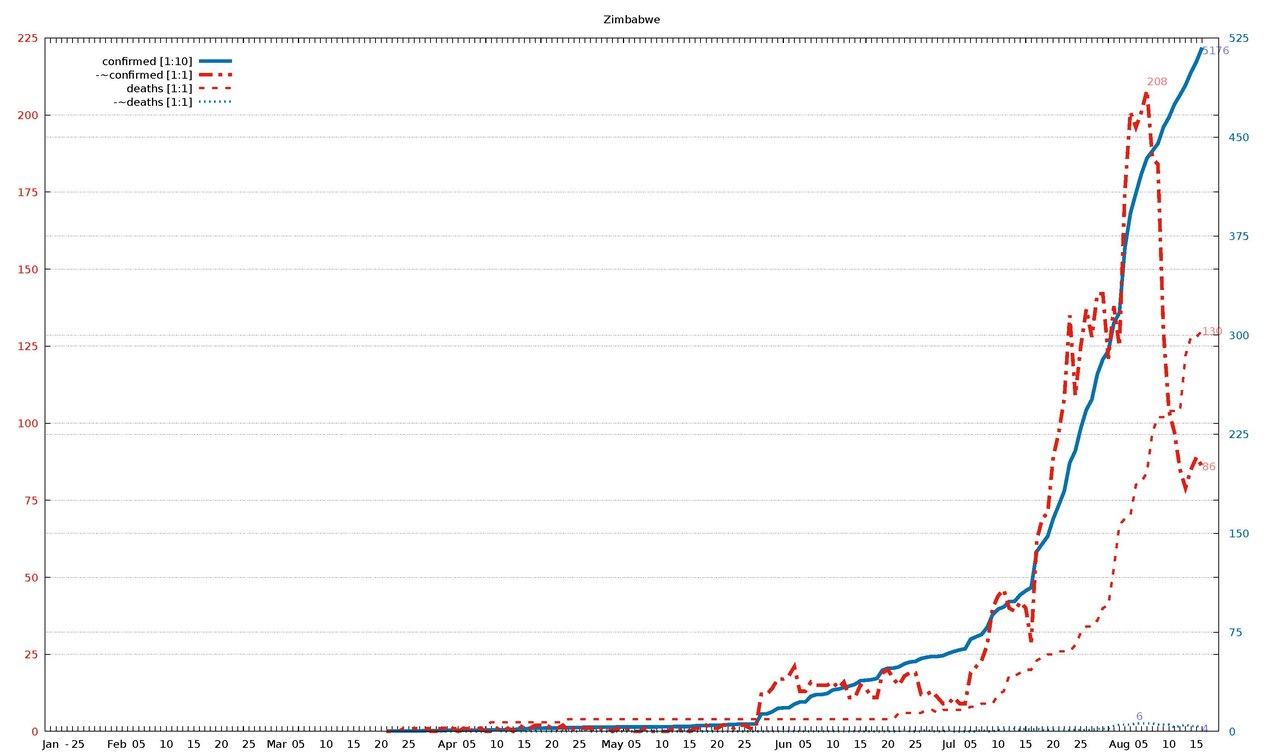
English: Diagram of WHO COVID-19 daily data (20 Jan - 16 Aug 2020) for "Total Confirmed Cases" (thick solid line), its smoothed increment (thick dash-dotted line), "Total Deaths" (thin dashed line) , and its smoothed increment (thin dotted line). Figures are taken from the available situation reports. Red and blue lines refer to the left and right vertical axis, respectively; the scaling factor for each curve is given in the legend. The horizontal axis starts on 20 Jan 2020 (situation report 1), and ends on 16 Aug 2020 (situation report 209). In the smoothed curves, for each day, 1/7 of the difference of the current day's figure and the figure a week ago is shown. For example, in situation report 115 (14 May 2020) and 121 (21 May 2020), there were 8676 and 5339 Total Confirmed Cases in Afghanistan, respectively, so the thick dash-dotted line passes through 477 = (8676-5339)/7 on 21 May.
For an overview of all related visualizations, and a more detailled description, see WHO Covid diagram set#Available country diagrams Jan-Aug 2020 (daily). |
| Date | |
| Source | Own work |
| Author | Jochen Burghardt |
Licensing[edit]
I, the copyright holder of this work, hereby publish it under the following license:
This file is licensed under the Creative Commons Attribution-Share Alike 4.0 International license.
- You are free:
- to share – to copy, distribute and transmit the work
- to remix – to adapt the work
- Under the following conditions:
- attribution – You must give appropriate credit, provide a link to the license, and indicate if changes were made. You may do so in any reasonable manner, but not in any way that suggests the licensor endorses you or your use.
- share alike – If you remix, transform, or build upon the material, you must distribute your contributions under the same or compatible license as the original.
Gnuplot source code[edit]
| Gnuplot source code |
|---|
set term pdf size 22,13
set term pdf font "sans,20"
set output "WHO_Covid_C_Zimbabwe.pdf"
set key autotitle columnhead
set termoption noenhanced
# (1) norm: 518 208 130 001
# (2) dist: 1,0:249 2,0:250 2,1:160
# (3,4) dist max: 250 2:130--0:518
# (4) right: 1 0 0 1
# (6,7) scMax: 225 525
# (8) scale: [1:10] [1:1] [1:1] [1:1]


set xrange [-1:212]
set yrange [0:225]
set y2range [0:525]
set xtics 3650,100
set ytics 25 textcolor "#e51e10"
set y2tics 75 textcolor "#0072b2"
set grid y y2

set title "Zimbabwe"

$data <<EOF
rep day "confirmed [1:10]" "-~confirmed [1:1]" "deaths [1:1]" "-~deaths [1:1]"
1	Jan	.	-	.	-
2	""	.	-	.	-
3	""	.	-	.	-
-	-	-	-	-	-
4	""	.	-	.	-
5	25	.	-	.	-
6	""	.	-	.	-
7	""	.	-	.	-
8	""	.	-	.	-
9	""	.	-	.	-
10	""	.	-	.	-
11	""	.	-	.	-
12	Feb	.	-	.	-
13	""	.	-	.	-
14	""	.	-	.	-
15	""	.	-	.	-
16	05	.	-	.	-
17	""	.	-	.	-
18	""	.	-	.	-
19	""	.	-	.	-
20	""	.	-	.	-
21	10	.	-	.	-
22	""	.	-	.	-
23	""	.	-	.	-
24	""	.	-	.	-
25	""	.	-	.	-
26	15	.	-	.	-
27	""	.	-	.	-
28	""	.	-	.	-
29	""	.	-	.	-
30	""	.	-	.	-
31	20	.	-	.	-
32	""	.	-	.	-
33	""	.	-	.	-
34	""	.	-	.	-
35	""	.	-	.	-
36	25	.	-	.	-
37	""	.	-	.	-
38	""	.	-	.	-
39	""	.	-	.	-
40	""	.	-	.	-
41	Mar	.	-	.	-
42	""	.	-	.	-
43	""	.	-	.	-
44	""	.	-	.	-
45	05	.	-	.	-
46	""	.	-	.	-
47	""	.	-	.	-
48	""	.	-	.	-
49	""	.	-	.	-
50	10	.	-	.	-
51	""	.	-	.	-
52	""	.	-	.	-
53	""	.	-	.	-
54	""	.	-	.	-
55	15	.	-	.	-
56	""	.	-	.	-
57	""	.	-	.	-
58	""	.	-	.	-
59	""	.	-	.	-
60	20	.	-	.	-
61	""	1	-	0	-
62	""	2	-	0	-
63	""	2	-	0	-
64	""	2	-	1	-
65	25	2	-	1	-
66	""	2	-	1	-
67	""	3	-	1	-
68	""	5	1	1	0
69	""	5	0	1	0
70	""	5	0	1	0
71	""	5	1	1	0
72	Apr	8	1	1	0
73	""	8	1	1	0
74	""	8	0	1	0
75	""	9	1	1	0
76	05	9	0	1	0
77	""	9	1	1	0
78	""	9	1	1	0
79	""	11	0	2	0
80	""	11	0	3	0
81	10	11	1	3	1
82	""	11	0	3	0
83	""	13	1	3	0
84	""	14	0	3	1
85	""	17	2	3	0
86	15	18	1	3	0
87	""	23	1	3	0
88	""	23	2	3	0
89	""	24	2	3	0
90	""	25	2	3	0
91	20	25	1	3	0
92	""	25	1	3	0
93	""	28	2	3	0
94	""	28	0	4	0
95	""	28	1	4	0
96	25	29	1	4	0
97	""	31	1	4	1
98	""	31	1	4	0
99	""	31	0	4	0
100	""	32	1	4	0
101	""	32	1	4	0
102	May	32	0	4	0
103	""	34	1	4	0
104	""	34	0	4	0
105	""	34	1	4	0
106	05	34	0	4	0
107	""	34	0	4	0
108	""	34	1	4	0
109	""	34	0	4	0
110	""	34	0	4	0
111	10	35	0	4	0
112	""	36	0	4	0
113	""	36	1	4	0
114	""	37	0	4	0
115	""	37	1	4	0
116	15	37	0	4	0
117	""	42	1	4	0
118	""	44	1	4	0
119	""	44	2	4	0
120	""	46	1	4	0
121	20	46	1	4	0
122	""	48	2	4	0
123	""	51	2	4	0
124	""	51	1	4	0
125	""	56	2	4	0
126	25	56	2	4	0
127	""	56	1	4	0
128	""	56	1	4	0
129	""	132	12	4	0
130	""	132	12	4	0
131	""	149	14	4	0
132	""	174	17	4	0
133	Jun	178	17	4	0
134	""	178	18	4	0
135	""	206	21	4	0
136	""	222	13	4	0
137	05	222	13	4	0
138	""	265	16	4	0
139	""	279	15	4	0
140	""	279	15	4	0
141	""	287	15	4	0
142	10	314	16	4	0
143	""	320	14	4	0
144	""	332	16	4	0
145	""	343	11	4	0
146	""	356	11	4	0
147	15	383	15	4	0
148	""	387	14	4	0
149	""	391	11	4	0
150	""	401	11	4	0
151	""	463	19	4	0
152	20	479	20	4	0
153	""	479	17	4	0
154	""	489	15	6	0
155	""	512	18	6	1
156	""	525	19	6	0
157	25	530	19	6	0
158	""	551	12	6	0
159	""	561	12	7	1
160	""	567	13	7	0
161	""	567	11	6	0
162	""	574	9	7	0
163	Jul	591	9	7	1
164	""	605	11	7	0
165	""	617	9	7	0
166	""	625	9	7	0
167	05	698	19	8	0
168	""	716	21	8	0
169	""	734	23	9	1
170	""	787	28	9	0
171	""	885	40	9	0
172	10	926	44	12	1
173	""	942	46	13	1
174	""	982	40	18	1
175	""	985	39	18	2
176	""	1034	42	19	1
177	15	1064	40	20	2
178	""	1089	29	20	1
179	""	1362	62	23	2
180	""	1420	69	24	1
181	""	1478	71	25	1
182	20	1611	89	25	1
183	""	1713	97	26	1
184	""	1820	108	26	1
185	""	2034	135	26	1
186	""	2124	109	28	1
187	25	2296	125	32	1
188	""	2434	137	34	1
189	""	2512	128	34	1
190	""	2704	142	36	2
191	""	2817	142	40	2
192	""	2879	121	41	2
193	""	3092	138	53	4
194	Aug	3169	125	67	5
195	""	3659	175	69	5
196	""	3921	201	70	5
197	""	4075	196	80	6
198	05	4221	201	81	6
199	""	4339	208	84	6
200	""	4395	186	97	6
201	""	4451	184	102	5
202	""	4575	130	102	5
203	10	4649	104	104	5
204	""	4748	97	104	3
205	""	4818	85	104	4
206	""	4893	79	122	5
207	""	4990	85	128	4
208	15	5072	89	128	4
209	""	5176	86	130	4
EOF

# confirmed:
set label "5176   " at first 209,517*225/525   left back textcolor "#8080ff"
# -~confirmed:
set label "86     " at first 209, 86           left back textcolor "#ff8080"
set label "208    " at first 199,208        +3 left back textcolor "#ff8080"
# deaths:
set label "130    " at first 209,130           left back textcolor "#ff8080"
# -~deaths:
set label "4      " at first 209,  4*225/525   left back textcolor "#8080ff"
set label "6      " at first 197,  6*225/525+3 left back textcolor "#8080ff"

set multiplot
  plot $data using 0:($3/     10*225/525) with lines lc 6 lw 8 dt 1 title at 0.150, 0.920
replot $data using 0:($4/      1        ) with lines lc 7 lw 8 dt 4 title at 0.150, 0.902
replot $data using 0:($5/      1        ) with lines lc 7 lw 5 dt 2 title at 0.150, 0.884
replot $data using 0:($6/      1*225/525) with lines lc 6 lw 5 dt 3 title at 0.150, 0.866

# plot hor axis calendar
replot $data using 0:(0):xticlabel(2) with lines
|
File history
Click on a date/time to view the file as it appeared at that time.
| Date/Time | Thumbnail | Dimensions | User | Comment | |
|---|---|---|---|---|---|
| current | 18:33, 24 September 2020 |  | 3,300 × 1,950 (22 KB) | Jochen Burghardt (talk | contribs) | =={{int:filedesc}}== {{Information |description={{en|1=Diagram of WHO COVID-19 daily data (20 Jan - 16 Aug 2020) for ''"Total Confirmed Cases"'' (thick solid line), its smoothed increment (thick dash-dotted line), ''"Total Deaths"'' (thin dashed line), and its smoothed increment (thin dotted line); see File:WHO_Covid_2020_Jan-Aug_daily_C_Afghanistan.pdf for details.}} |date=2020-09-24 |source={{own}} |author=Jochen Burghardt |permission= |other_versions=[[:File:... |
You cannot overwrite this file.
File usage on Commons
There are no pages that use this file.