File:WHO Covid 2020 Jan-Aug daily C Yemen.pdf
Jump to navigation
Jump to search

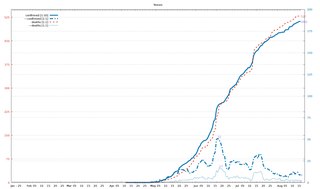
Size of this JPG preview of this PDF file: 800 × 473 pixels. Other resolutions: 320 × 189 pixels | 640 × 378 pixels | 1,024 × 605 pixels | 1,280 × 756 pixels | 3,300 × 1,950 pixels.
Original file (3,300 × 1,950 pixels, file size: 22 KB, MIME type: application/pdf)
Captions
Captions
Add a one-line explanation of what this file represents
Summary[edit]
| Description |
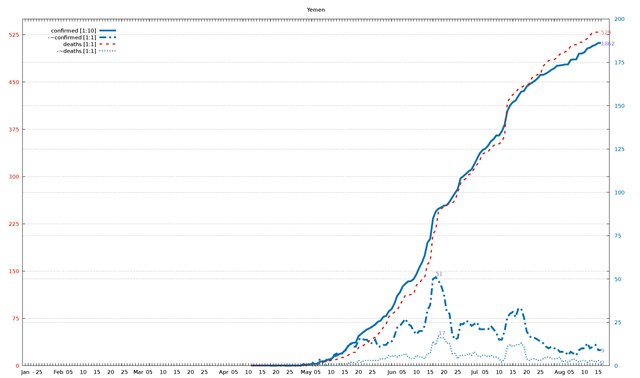
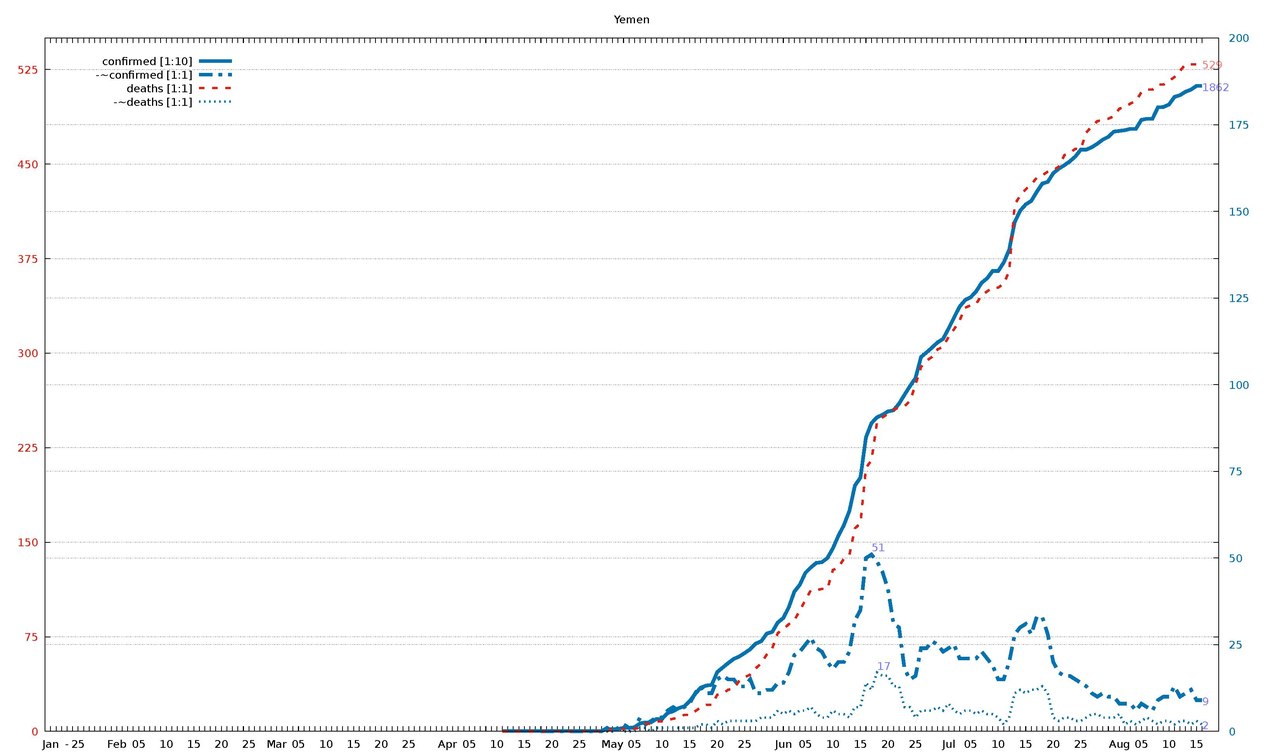
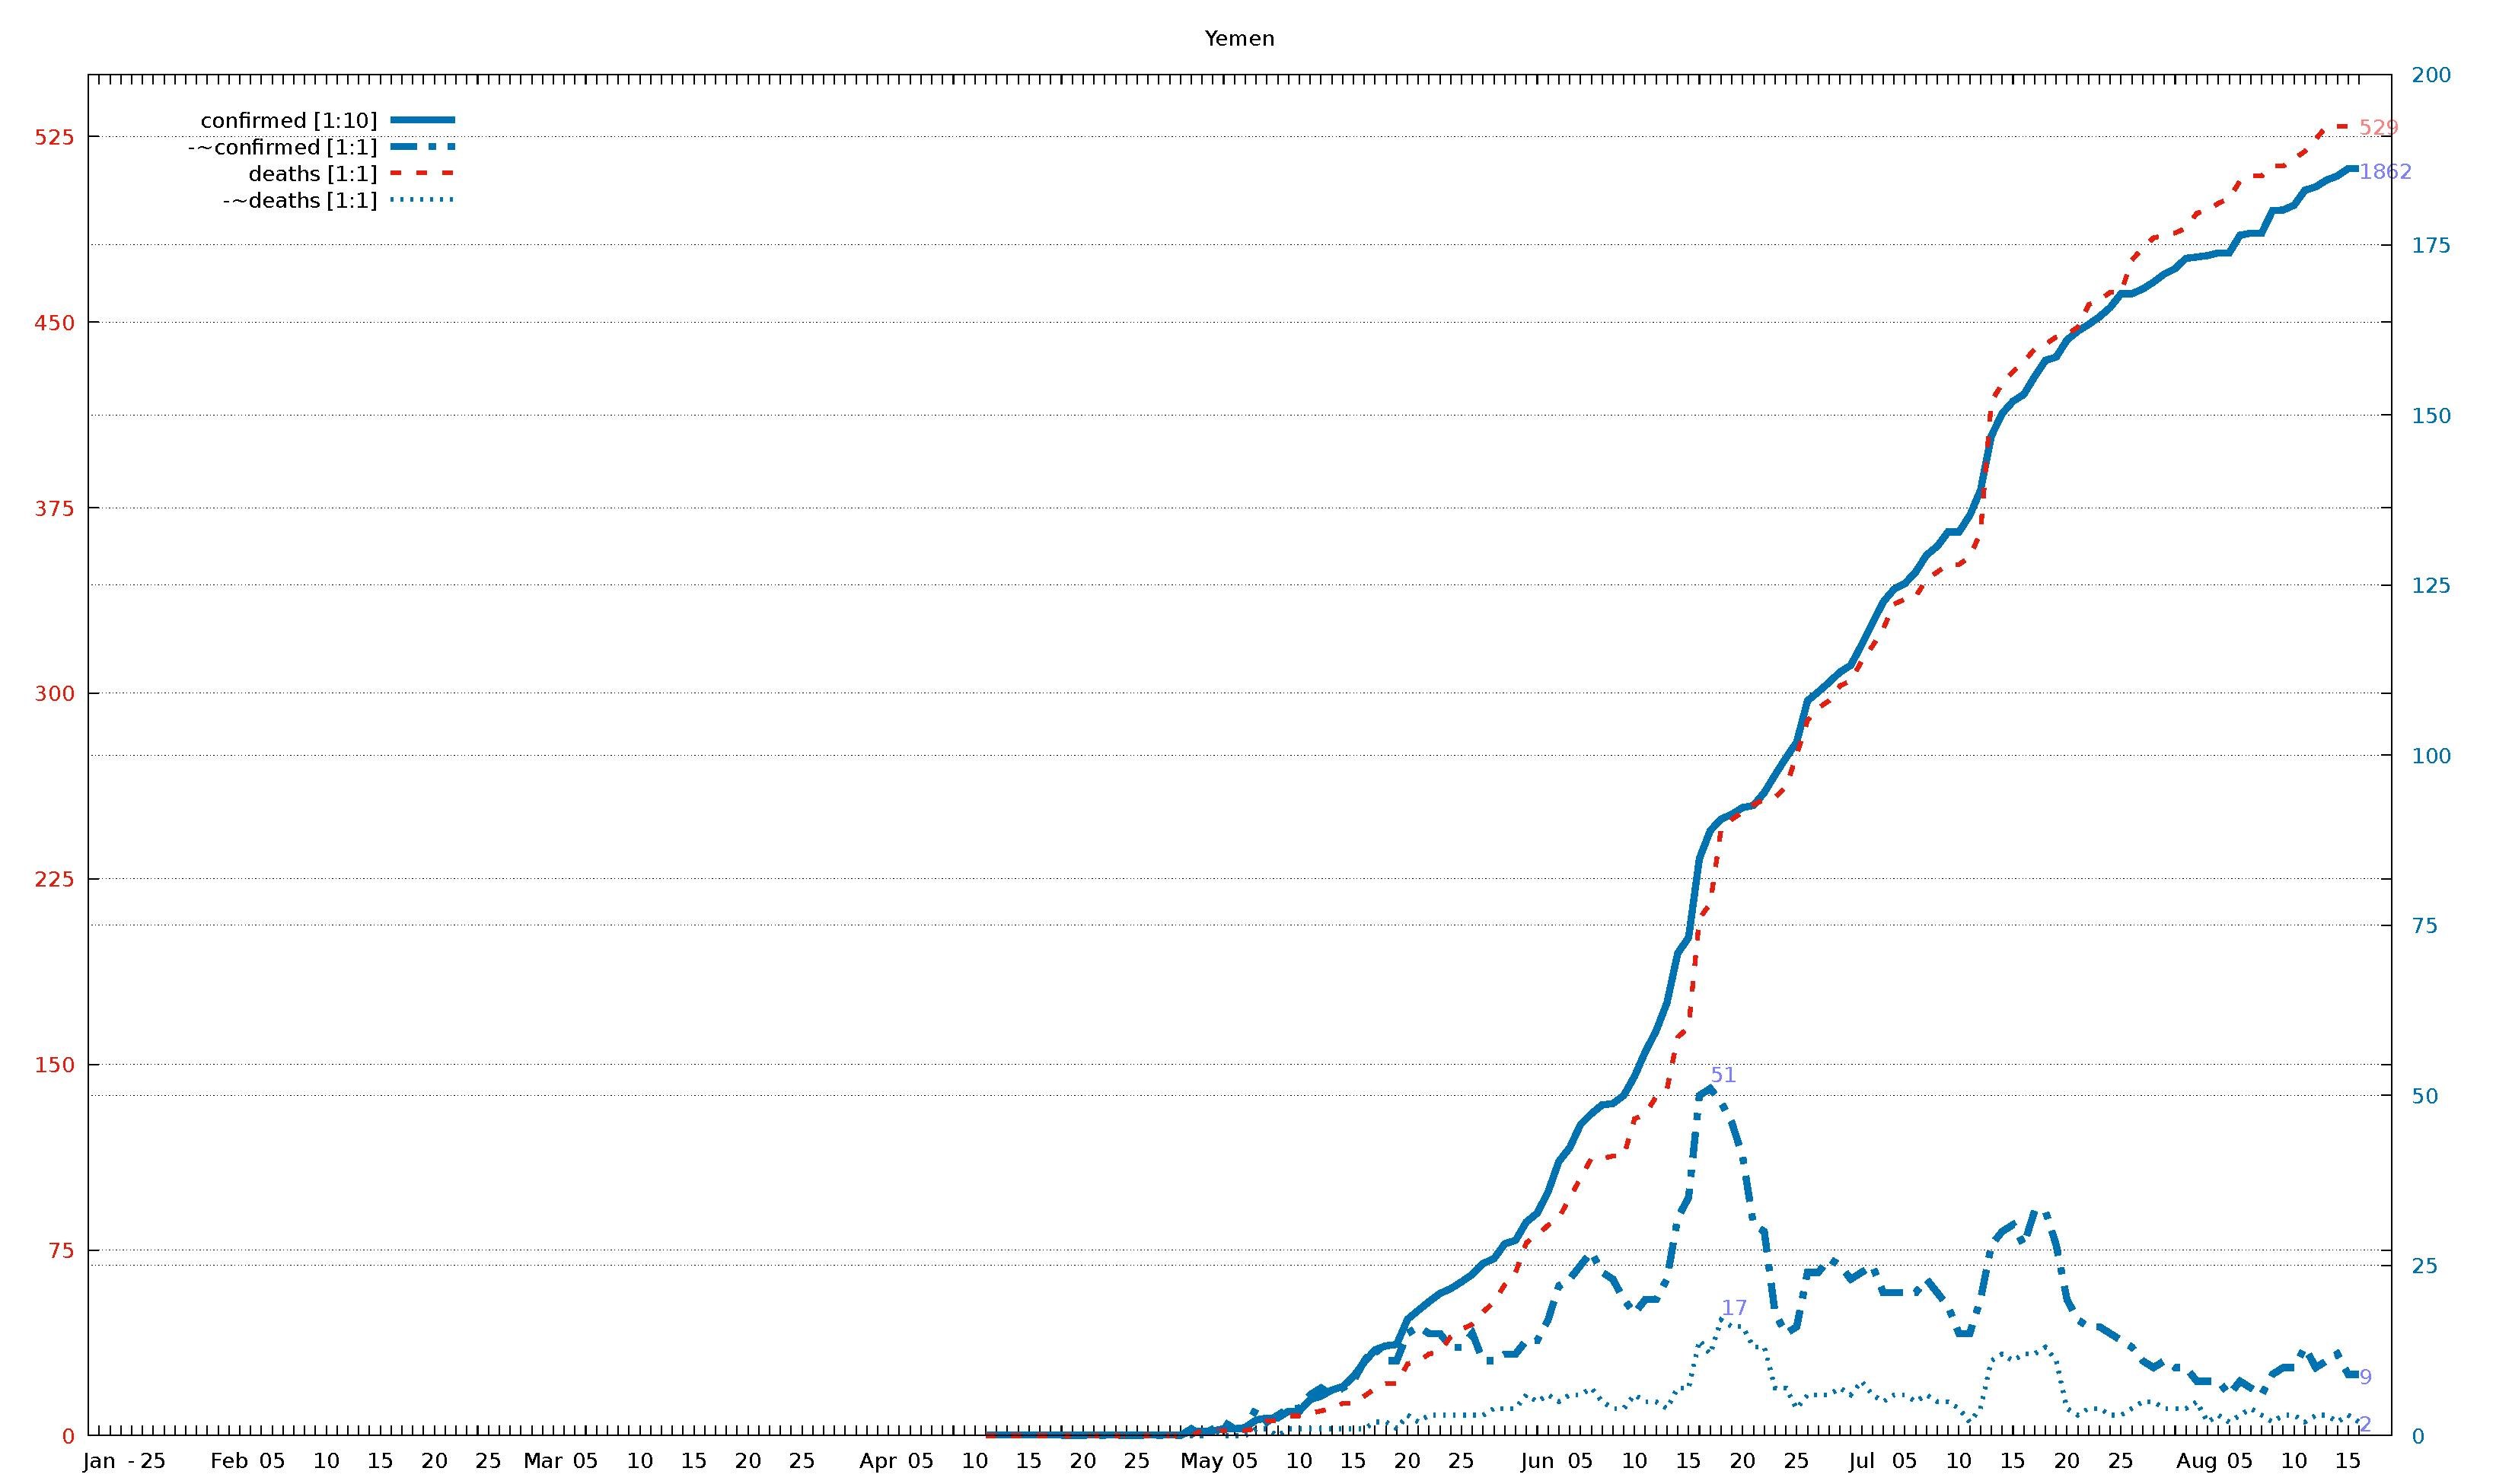
English: Diagram of WHO COVID-19 daily data (20 Jan - 16 Aug 2020) for "Total Confirmed Cases" (thick solid line), its smoothed increment (thick dash-dotted line), "Total Deaths" (thin dashed line) , and its smoothed increment (thin dotted line). Figures are taken from the available situation reports. Red and blue lines refer to the left and right vertical axis, respectively; the scaling factor for each curve is given in the legend. The horizontal axis starts on 20 Jan 2020 (situation report 1), and ends on 16 Aug 2020 (situation report 209). In the smoothed curves, for each day, 1/7 of the difference of the current day's figure and the figure a week ago is shown. For example, in situation report 115 (14 May 2020) and 121 (21 May 2020), there were 8676 and 5339 Total Confirmed Cases in Afghanistan, respectively, so the thick dash-dotted line passes through 477 = (8676-5339)/7 on 21 May.
For an overview of all related visualizations, and a more detailled description, see WHO Covid diagram set#Available country diagrams Jan-Aug 2020 (daily). |
| Date | |
| Source | Own work |
| Author | Jochen Burghardt |
Licensing[edit]
I, the copyright holder of this work, hereby publish it under the following license:
This file is licensed under the Creative Commons Attribution-Share Alike 4.0 International license.
- You are free:
- to share – to copy, distribute and transmit the work
- to remix – to adapt the work
- Under the following conditions:
- attribution – You must give appropriate credit, provide a link to the license, and indicate if changes were made. You may do so in any reasonable manner, but not in any way that suggests the licensor endorses you or your use.
- share alike – If you remix, transform, or build upon the material, you must distribute your contributions under the same or compatible license as the original.
Gnuplot source code[edit]
| Gnuplot source code |
|---|
set term pdf size 22,13
set term pdf font "sans,20"
set output "WHO_Covid_C_Yemen.pdf"
set key autotitle columnhead
set termoption noenhanced
# (1) norm: 187 001 529 001
# (2) dist: 2,0:283
# (3,4) dist max: 283 2:529--0:187
# (4) right: 1 1 0 1
# (6,7) scMax: 550 200
# (8) scale: [1:10] [1:1] [1:1] [1:1]


set xrange [-1:212]
set yrange [0:550]
set y2range [0:200]
set xtics 3650,100
set ytics 75 textcolor "#e51e10"
set y2tics 25 textcolor "#0072b2"
set grid y y2

set title "Yemen"

$data <<EOF
rep day "confirmed [1:10]" "-~confirmed [1:1]" "deaths [1:1]" "-~deaths [1:1]"
1	Jan	.	-	.	-
2	""	.	-	.	-
3	""	.	-	.	-
-	-	-	-	-	-
4	""	.	-	.	-
5	25	.	-	.	-
6	""	.	-	.	-
7	""	.	-	.	-
8	""	.	-	.	-
9	""	.	-	.	-
10	""	.	-	.	-
11	""	.	-	.	-
12	Feb	.	-	.	-
13	""	.	-	.	-
14	""	.	-	.	-
15	""	.	-	.	-
16	05	.	-	.	-
17	""	.	-	.	-
18	""	.	-	.	-
19	""	.	-	.	-
20	""	.	-	.	-
21	10	.	-	.	-
22	""	.	-	.	-
23	""	.	-	.	-
24	""	.	-	.	-
25	""	.	-	.	-
26	15	.	-	.	-
27	""	.	-	.	-
28	""	.	-	.	-
29	""	.	-	.	-
30	""	.	-	.	-
31	20	.	-	.	-
32	""	.	-	.	-
33	""	.	-	.	-
34	""	.	-	.	-
35	""	.	-	.	-
36	25	.	-	.	-
37	""	.	-	.	-
38	""	.	-	.	-
39	""	.	-	.	-
40	""	.	-	.	-
41	Mar	.	-	.	-
42	""	.	-	.	-
43	""	.	-	.	-
44	""	.	-	.	-
45	05	.	-	.	-
46	""	.	-	.	-
47	""	.	-	.	-
48	""	.	-	.	-
49	""	.	-	.	-
50	10	.	-	.	-
51	""	.	-	.	-
52	""	.	-	.	-
53	""	.	-	.	-
54	""	.	-	.	-
55	15	.	-	.	-
56	""	.	-	.	-
57	""	.	-	.	-
58	""	.	-	.	-
59	""	.	-	.	-
60	20	.	-	.	-
61	""	.	-	.	-
62	""	.	-	.	-
63	""	.	-	.	-
64	""	.	-	.	-
65	25	.	-	.	-
66	""	.	-	.	-
67	""	.	-	.	-
68	""	.	-	.	-
69	""	.	-	.	-
70	""	.	-	.	-
71	""	.	-	.	-
72	Apr	.	-	.	-
73	""	.	-	.	-
74	""	.	-	.	-
75	""	.	-	.	-
76	05	.	-	.	-
77	""	.	-	.	-
78	""	.	-	.	-
79	""	.	-	.	-
80	""	.	-	.	-
81	10	.	-	.	-
82	""	1	-	0	-
83	""	1	-	0	-
84	""	1	-	0	-
85	""	1	-	0	-
86	15	1	-	0	-
87	""	1	-	0	-
88	""	1	-	0	-
89	""	1	0	0	0
90	""	1	0	0	0
91	20	1	0	0	0
92	""	1	0	0	0
93	""	1	0	0	0
94	""	1	0	0	0
95	""	1	0	0	0
96	25	1	0	0	0
97	""	1	0	0	0
98	""	1	0	0	0
99	""	1	0	0	0
100	""	1	0	0	0
101	""	6	1	0	0
102	May	6	0	2	0
103	""	7	1	2	1
104	""	10	2	2	0
105	""	10	1	2	0
106	05	12	1	2	0
107	""	23	4	3	1
108	""	26	2	6	1
109	""	26	3	6	0
110	""	36	4	8	1
111	10	36	4	8	1
112	""	53	6	9	1
113	""	58	7	10	1
114	""	67	6	11	1
115	""	72	7	13	1
116	15	87	8	13	1
117	""	108	11	16	1
118	""	126	13	19	2
119	""	132	11	21	2
120	""	134	11	21	1
121	20	171	15	29	3
122	""	184	16	30	2
123	""	197	15	33	3
124	""	209	15	34	3
125	""	216	13	40	3
126	25	226	13	43	3
127	""	237	15	45	3
128	""	253	11	50	3
129	""	260	11	54	4
130	""	282	12	61	4
131	""	287	12	66	4
132	""	314	14	78	6
133	Jun	327	14	81	5
134	""	358	17	85	6
135	""	403	22	88	5
136	""	423	23	96	6
137	05	457	25	104	6
138	""	473	27	112	7
139	""	486	24	112	5
140	""	488	23	113	4
141	""	500	20	113	4
142	10	528	18	128	6
143	""	564	20	130	5
144	""	595	20	137	5
145	""	636	23	140	4
146	""	709	32	161	7
147	15	732	35	165	7
148	""	848	50	209	14
149	""	889	51	215	12
150	""	906	49	245	17
151	""	913	46	249	16
152	20	923	41	252	16
153	""	926	31	255	13
154	""	945	30	257	13
155	""	971	18	258	7
156	""	996	15	262	7
157	25	1019	16	275	4
158	""	1080	24	289	6
159	""	1093	24	294	6
160	""	1107	26	297	6
161	""	1122	25	303	7
162	""	1132	23	305	6
163	Jul	1162	24	313	8
164	""	1194	25	319	6
165	""	1225	21	326	5
166	""	1244	21	336	6
167	05	1252	21	338	6
168	""	1269	21	339	5
169	""	1294	23	346	6
170	""	1307	21	349	5
171	""	1328	19	352	5
172	10	1328	15	352	4
173	""	1352	15	355	2
174	""	1389	20	365	4
175	""	1469	28	418	11
176	""	1502	30	425	12
177	15	1520	31	430	11
178	""	1530	28	434	12
179	""	1556	33	439	12
180	""	1580	33	441	13
181	""	1585	28	444	11
182	20	1610	20	445	4
183	""	1623	17	448	3
184	""	1633	16	457	4
185	""	1644	16	459	4
186	""	1658	15	462	3
187	25	1678	14	462	3
188	""	1678	13	475	4
189	""	1685	11	480	5
190	""	1695	10	484	5
191	""	1707	11	485	4
192	""	1715	10	486	4
193	""	1730	10	488	4
194	Aug	1732	8	494	5
195	""	1734	8	495	2
196	""	1738	8	498	3
197	""	1738	6	500	2
198	05	1764	8	507	3
199	""	1767	7	509	4
200	""	1767	6	509	3
201	""	1800	9	513	2
202	""	1801	10	513	3
203	10	1808	10	516	3
204	""	1830	13	519	2
205	""	1835	10	524	3
206	""	1845	11	529	3
207	""	1851	12	529	2
208	15	1862	9	529	3
209	""	1862	9	529	2
EOF

# confirmed:
set label "1862   " at first 209,186*550/200   left back textcolor "#8080ff"
# -~confirmed:
set label "9      " at first 209,  9*550/200   left back textcolor "#8080ff"
set label "51     " at first 149, 51*550/200+6 left back textcolor "#8080ff"
# deaths:
set label "529    " at first 209,529           left back textcolor "#ff8080"
# -~deaths:
set label "2      " at first 209,  2*550/200   left back textcolor "#8080ff"
set label "17     " at first 150, 17*550/200+6 left back textcolor "#8080ff"

set multiplot
  plot $data using 0:($3/     10*550/200) with lines lc 6 lw 8 dt 1 title at 0.150, 0.920
replot $data using 0:($4/      1*550/200) with lines lc 6 lw 8 dt 4 title at 0.150, 0.902
replot $data using 0:($5/      1        ) with lines lc 7 lw 5 dt 2 title at 0.150, 0.884
replot $data using 0:($6/      1*550/200) with lines lc 6 lw 5 dt 3 title at 0.150, 0.866

# plot hor axis calendar
replot $data using 0:(0):xticlabel(2) with lines
|
File history
Click on a date/time to view the file as it appeared at that time.
| Date/Time | Thumbnail | Dimensions | User | Comment | |
|---|---|---|---|---|---|
| current | 19:47, 24 September 2020 |  | 3,300 × 1,950 (22 KB) | Jochen Burghardt (talk | contribs) | =={{int:filedesc}}== {{Information |description={{en|1=Diagram of WHO COVID-19 daily data (20 Jan - 16 Aug 2020) for ''"Total Confirmed Cases"'' (thick solid line), its smoothed increment (thick dash-dotted line), ''"Total Deaths"'' (thin dashed line), and its smoothed increment (thin dotted line); see File:WHO_Covid_2020_Jan-Aug_daily_C_Afghanistan.pdf for details.}} |date=2020-09-24 |source={{own}} |author=Jochen Burghardt |permission= |other_versions=[[:File:... |
You cannot overwrite this file.
File usage on Commons
There are no pages that use this file.