File:WHO Covid 2020 Jan-Aug daily C Uganda.pdf
Jump to navigation
Jump to search

Size of this JPG preview of this PDF file: 800 × 473 pixels. Other resolutions: 320 × 189 pixels | 640 × 378 pixels | 1,024 × 605 pixels | 1,280 × 756 pixels | 3,300 × 1,950 pixels.
Original file (3,300 × 1,950 pixels, file size: 20 KB, MIME type: application/pdf)
Captions
Captions
Add a one-line explanation of what this file represents
Summary[edit]
| Description |
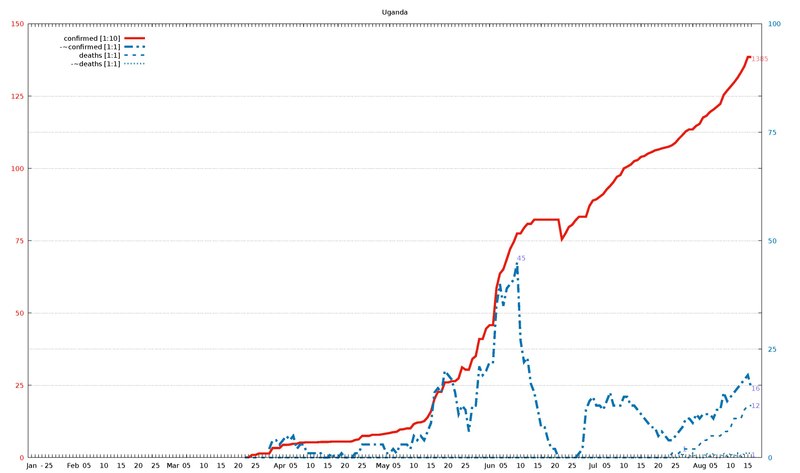
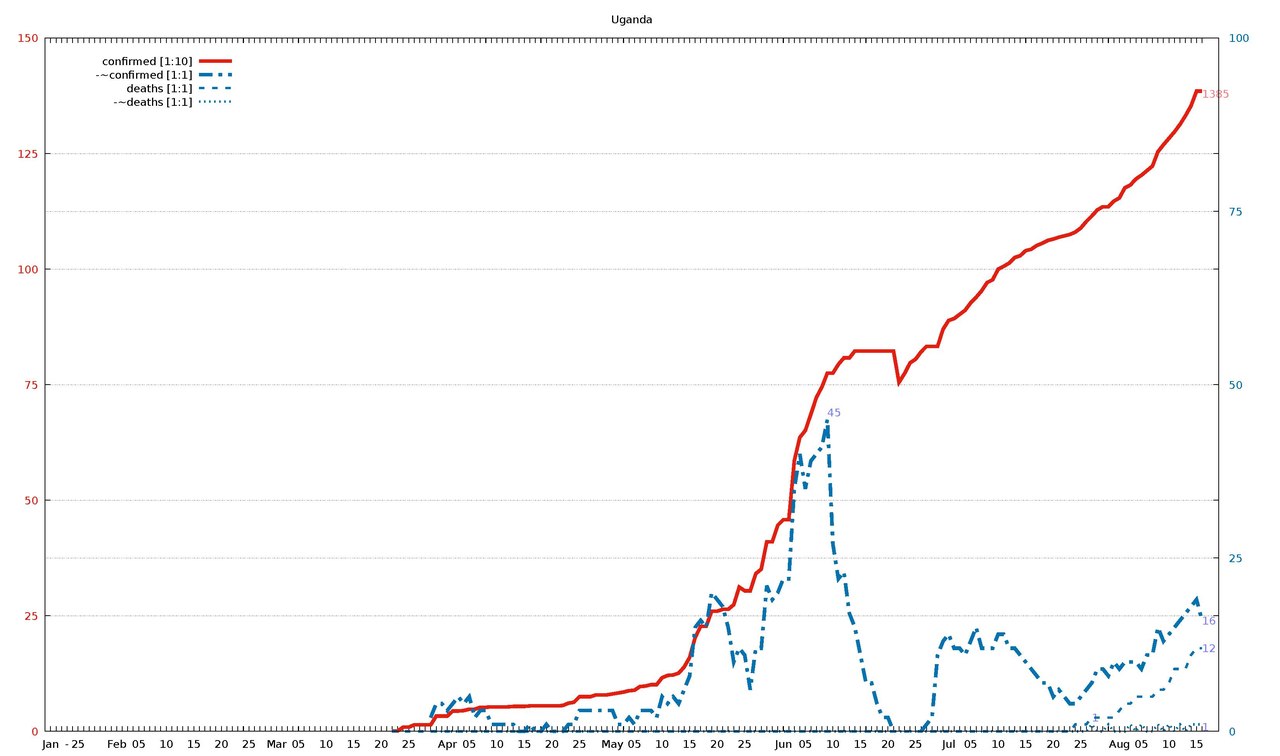
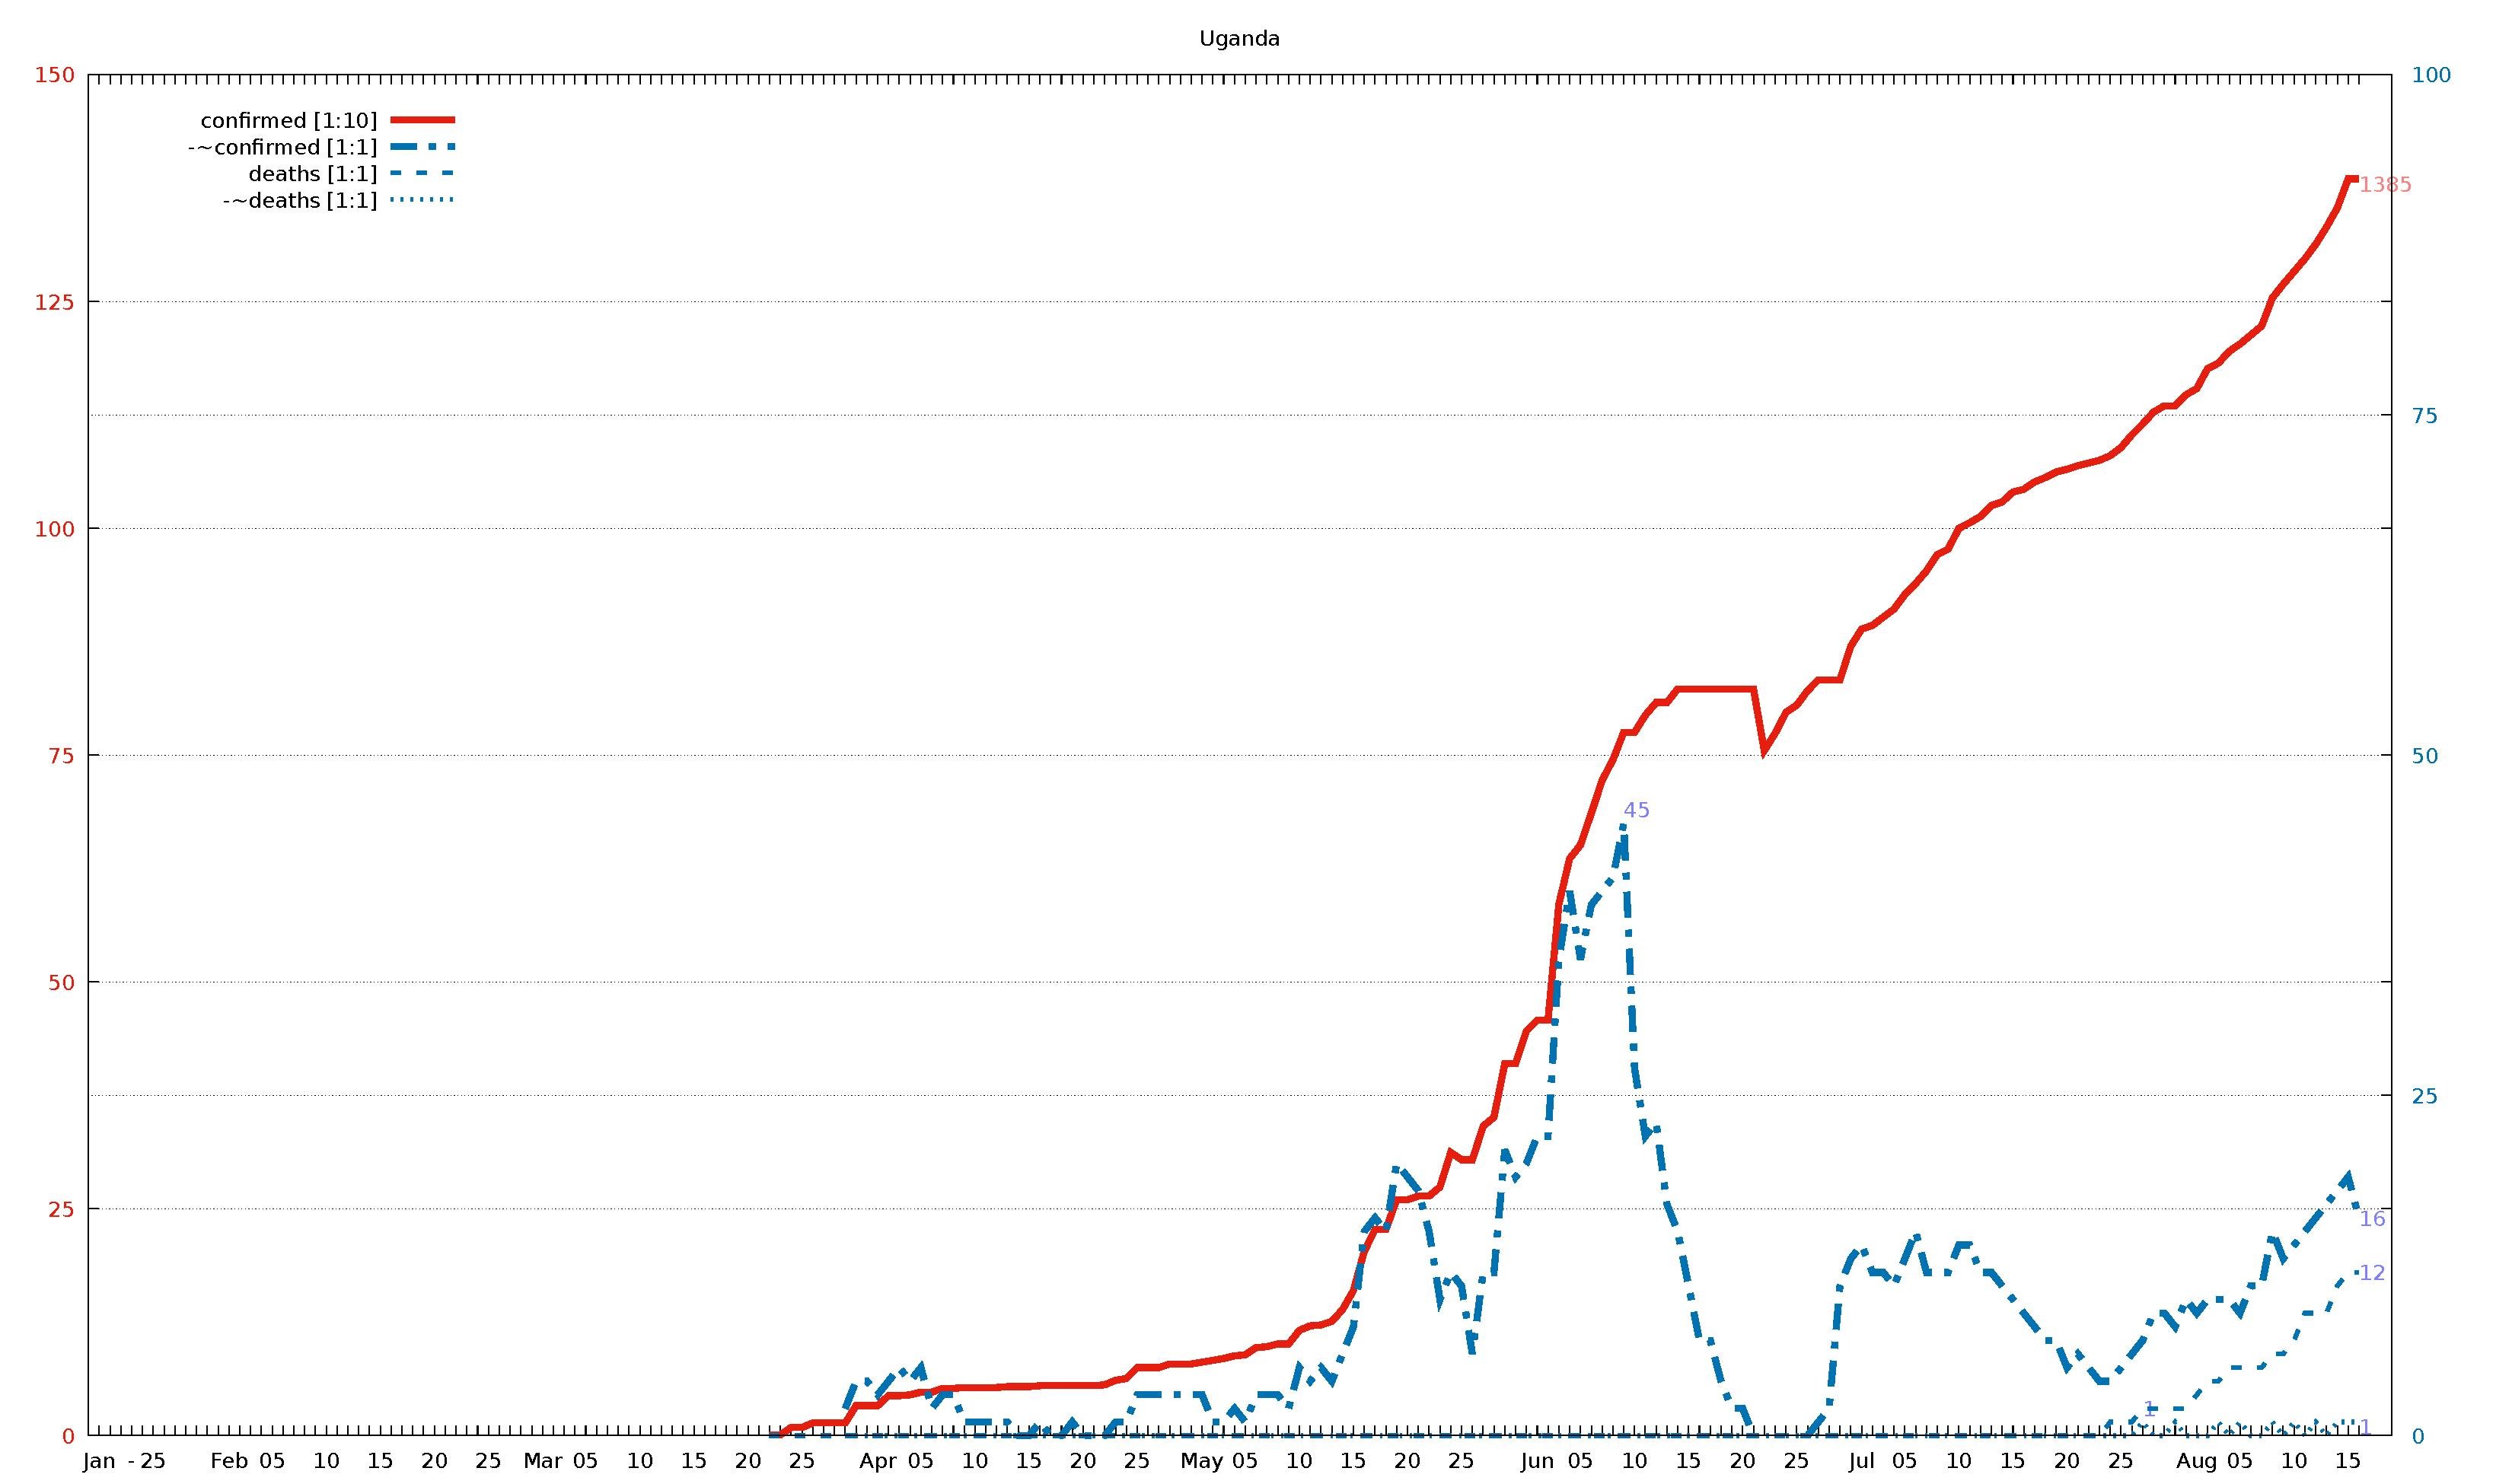
English: Diagram of WHO COVID-19 daily data (20 Jan - 16 Aug 2020) for "Total Confirmed Cases" (thick solid line), its smoothed increment (thick dash-dotted line), "Total Deaths" (thin dashed line) , and its smoothed increment (thin dotted line). Figures are taken from the available situation reports. Red and blue lines refer to the left and right vertical axis, respectively; the scaling factor for each curve is given in the legend. The horizontal axis starts on 20 Jan 2020 (situation report 1), and ends on 16 Aug 2020 (situation report 209). In the smoothed curves, for each day, 1/7 of the difference of the current day's figure and the figure a week ago is shown. For example, in situation report 115 (14 May 2020) and 121 (21 May 2020), there were 8676 and 5339 Total Confirmed Cases in Afghanistan, respectively, so the thick dash-dotted line passes through 477 = (8676-5339)/7 on 21 May.
For an overview of all related visualizations, and a more detailled description, see WHO Covid diagram set#Available country diagrams Jan-Aug 2020 (daily). |
| Date | |
| Source | Own work |
| Author | Jochen Burghardt |
Licensing[edit]
I, the copyright holder of this work, hereby publish it under the following license:
This file is licensed under the Creative Commons Attribution-Share Alike 4.0 International license.
- You are free:
- to share – to copy, distribute and transmit the work
- to remix – to adapt the work
- Under the following conditions:
- attribution – You must give appropriate credit, provide a link to the license, and indicate if changes were made. You may do so in any reasonable manner, but not in any way that suggests the licensor endorses you or your use.
- share alike – If you remix, transform, or build upon the material, you must distribute your contributions under the same or compatible license as the original.
Gnuplot source code[edit]
| Gnuplot source code |
|---|
set term pdf size 22,13
set term pdf font "sans,20"
set output "WHO_Covid_C_Uganda.pdf"
set key autotitle columnhead
set termoption noenhanced
# (1) norm: 139 001 001 001

set xrange [-1:212]
set yrange [0:150]
set y2range [0:100]
set xtics 3650,100
set ytics 25 textcolor "#e51e10"
set y2tics 25 textcolor "#0072b2"
set grid y y2

set title "Uganda"

$data <<EOF
rep day "confirmed [1:10]" "-~confirmed [1:1]" "deaths [1:1]" "-~deaths [1:1]"
1	Jan	.	-	.	-
2	""	.	-	.	-
3	""	.	-	.	-
-	-	-	-	-	-
4	""	.	-	.	-
5	25	.	-	.	-
6	""	.	-	.	-
7	""	.	-	.	-
8	""	.	-	.	-
9	""	.	-	.	-
10	""	.	-	.	-
11	""	.	-	.	-
12	Feb	.	-	.	-
13	""	.	-	.	-
14	""	.	-	.	-
15	""	.	-	.	-
16	05	.	-	.	-
17	""	.	-	.	-
18	""	.	-	.	-
19	""	.	-	.	-
20	""	.	-	.	-
21	10	.	-	.	-
22	""	.	-	.	-
23	""	.	-	.	-
24	""	.	-	.	-
25	""	.	-	.	-
26	15	.	-	.	-
27	""	.	-	.	-
28	""	.	-	.	-
29	""	.	-	.	-
30	""	.	-	.	-
31	20	.	-	.	-
32	""	.	-	.	-
33	""	.	-	.	-
34	""	.	-	.	-
35	""	.	-	.	-
36	25	.	-	.	-
37	""	.	-	.	-
38	""	.	-	.	-
39	""	.	-	.	-
40	""	.	-	.	-
41	Mar	.	-	.	-
42	""	.	-	.	-
43	""	.	-	.	-
44	""	.	-	.	-
45	05	.	-	.	-
46	""	.	-	.	-
47	""	.	-	.	-
48	""	.	-	.	-
49	""	.	-	.	-
50	10	.	-	.	-
51	""	.	-	.	-
52	""	.	-	.	-
53	""	.	-	.	-
54	""	.	-	.	-
55	15	.	-	.	-
56	""	.	-	.	-
57	""	.	-	.	-
58	""	.	-	.	-
59	""	.	-	.	-
60	20	.	-	.	-
61	""	.	-	.	-
62	""	1	-	0	-
63	""	1	-	0	-
64	""	9	-	0	-
65	25	9	-	0	-
66	""	14	-	0	-
67	""	14	-	0	-
68	""	14	-	0	-
69	""	14	2	0	0
70	""	33	4	0	0
71	""	33	4	0	0
72	Apr	33	3	0	0
73	""	44	4	0	0
74	""	44	5	0	0
75	""	45	4	0	0
76	05	48	5	0	0
77	""	48	2	0	0
78	""	52	3	0	0
79	""	52	3	0	0
80	""	53	1	0	0
81	10	53	1	0	0
82	""	53	1	0	0
83	""	53	1	0	0
84	""	54	1	0	0
85	""	54	0	0	0
86	15	54	0	0	0
87	""	55	1	0	0
88	""	55	0	0	0
89	""	55	0	0	0
90	""	55	1	0	0
91	20	55	0	0	0
92	""	55	0	0	0
93	""	56	0	0	0
94	""	61	1	0	0
95	""	63	1	0	0
96	25	75	3	0	0
97	""	75	3	0	0
98	""	75	3	0	0
99	""	79	3	0	0
100	""	79	3	0	0
101	""	79	3	0	0
102	May	81	3	0	0
103	""	83	1	0	0
104	""	85	1	0	0
105	""	88	2	0	0
106	05	89	1	0	0
107	""	97	3	0	0
108	""	98	3	0	0
109	""	101	3	0	0
110	""	101	2	0	0
111	10	116	5	0	0
112	""	121	4	0	0
113	""	122	5	0	0
114	""	126	4	0	0
115	""	139	6	0	0
116	15	160	8	0	0
117	""	203	15	0	0
118	""	227	16	0	0
119	""	227	15	0	0
120	""	260	20	0	0
121	20	260	19	0	0
122	""	264	18	0	0
123	""	264	15	0	0
124	""	274	10	0	0
125	""	312	12	0	0
126	25	304	11	0	0
127	""	304	6	0	0
128	""	341	12	0	0
129	""	351	12	0	0
130	""	410	21	0	0
131	""	410	19	0	0
132	""	446	20	0	0
133	Jun	458	22	0	0
134	""	458	22	0	0
135	""	586	35	0	0
136	""	636	40	0	0
137	05	651	35	0	0
138	""	686	39	0	0
139	""	722	40	0	0
140	""	745	41	0	0
141	""	775	45	0	0
142	10	775	27	0	0
143	""	794	22	0	0
144	""	808	23	0	0
145	""	808	17	0	0
146	""	823	15	0	0
147	15	823	11	0	0
148	""	823	7	0	0
149	""	823	7	0	0
150	""	823	4	0	0
151	""	823	2	0	0
152	20	823	2	0	0
153	""	823	0	0	0
154	""	755	-10	0	0
155	""	774	-7	0	0
156	""	797	-3	0	0
157	25	805	-3	0	0
158	""	821	0	0	0
159	""	833	1	0	0
160	""	833	2	0	0
161	""	833	11	0	0
162	""	870	13	0	0
163	Jul	889	14	0	0
164	""	893	12	0	0
165	""	902	12	0	0
166	""	911	11	0	0
167	05	927	13	0	0
168	""	939	15	0	0
169	""	953	12	0	0
170	""	971	12	0	0
171	""	977	12	0	0
172	10	1000	14	0	0
173	""	1006	14	0	0
174	""	1013	12	0	0
175	""	1025	12	0	0
176	""	1029	11	0	0
177	15	1040	10	0	0
178	""	1043	9	0	0
179	""	1051	8	0	0
180	""	1056	7	0	0
181	""	1062	7	0	0
182	20	1065	5	0	0
183	""	1069	6	0	0
184	""	1072	5	0	0
185	""	1075	4	0	0
186	""	1080	4	1	0
187	25	1089	5	1	0
188	""	1103	6	1	0
189	""	1115	7	2	1
190	""	1128	9	2	0
191	""	1135	9	2	0
192	""	1135	8	2	1
193	""	1147	10	2	0
194	Aug	1154	9	3	0
195	""	1176	10	4	0
196	""	1182	10	4	1
197	""	1195	10	5	0
198	05	1203	9	5	1
199	""	1213	11	5	0
200	""	1223	11	5	0
201	""	1254	15	6	1
202	""	1269	13	6	0
203	10	1283	14	7	1
204	""	1297	15	9	0
205	""	1313	16	9	1
206	""	1332	17	9	0
207	""	1353	18	11	1
208	15	1385	19	12	1
209	""	1385	16	12	1
EOF

# confirmed:
set label "1385   " at first 209,138           left back textcolor "#ff8080"
# -~confirmed:
set label "16     " at first 209, 16*150/100   left back textcolor "#8080ff"
set label "45     " at first 141, 45*150/100+2 left back textcolor "#8080ff"
# deaths:
set label "12     " at first 209, 12*150/100   left back textcolor "#8080ff"
# -~deaths:
set label "1      " at first 209,  1*150/100   left back textcolor "#8080ff"
set label "1      " at first 189,  1*150/100+2 left back textcolor "#8080ff"

set multiplot
  plot $data using 0:($3/     10        ) with lines lc 7 lw 8 dt 1 title at 0.150, 0.920
replot $data using 0:($4/      1*150/100) with lines lc 6 lw 8 dt 4 title at 0.150, 0.902
replot $data using 0:($5/      1*150/100) with lines lc 6 lw 5 dt 2 title at 0.150, 0.884
replot $data using 0:($6/      1*150/100) with lines lc 6 lw 5 dt 3 title at 0.150, 0.866

# plot hor axis calendar
replot $data using 0:(0):xticlabel(2) with lines
|
File history
Click on a date/time to view the file as it appeared at that time.
| Date/Time | Thumbnail | Dimensions | User | Comment | |
|---|---|---|---|---|---|
| current | 19:44, 24 September 2020 |  | 3,300 × 1,950 (20 KB) | Jochen Burghardt (talk | contribs) | =={{int:filedesc}}== {{Information |description={{en|1=Diagram of WHO COVID-19 daily data (20 Jan - 16 Aug 2020) for ''"Total Confirmed Cases"'' (thick solid line), its smoothed increment (thick dash-dotted line), ''"Total Deaths"'' (thin dashed line), and its smoothed increment (thin dotted line); see File:WHO_Covid_2020_Jan-Aug_daily_C_Afghanistan.pdf for details.}} |date=2020-09-24 |source={{own}} |author=Jochen Burghardt |permission= |other_versions=[[:File:... |
You cannot overwrite this file.
File usage on Commons
There are no pages that use this file.