File:WHO Covid 2020 Jan-Aug daily C UAE.pdf
Jump to navigation
Jump to search

Size of this JPG preview of this PDF file: 800 × 473 pixels. Other resolutions: 320 × 189 pixels | 640 × 378 pixels | 1,024 × 605 pixels | 1,280 × 756 pixels | 3,300 × 1,950 pixels.
Original file (3,300 × 1,950 pixels, file size: 25 KB, MIME type: application/pdf)
Captions
Captions
Add a one-line explanation of what this file represents
Summary[edit]
| Description |
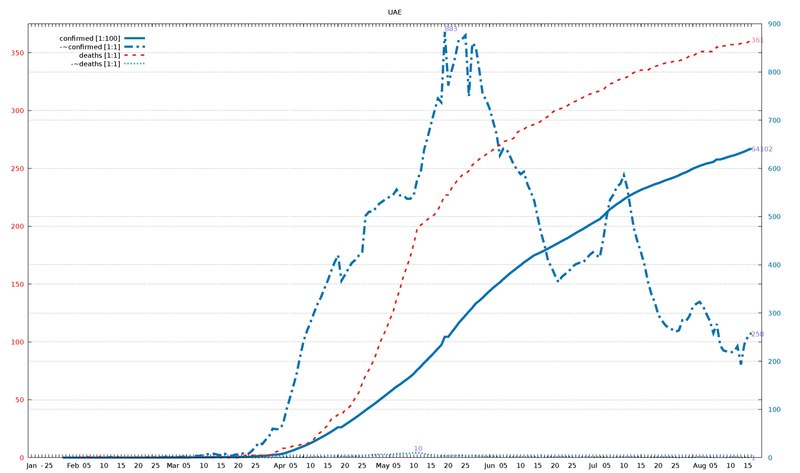
English: Diagram of WHO COVID-19 daily data (20 Jan - 16 Aug 2020) for "Total Confirmed Cases" (thick solid line), its smoothed increment (thick dash-dotted line), "Total Deaths" (thin dashed line) , and its smoothed increment (thin dotted line). Figures are taken from the available situation reports. Red and blue lines refer to the left and right vertical axis, respectively; the scaling factor for each curve is given in the legend. The horizontal axis starts on 20 Jan 2020 (situation report 1), and ends on 16 Aug 2020 (situation report 209). In the smoothed curves, for each day, 1/7 of the difference of the current day's figure and the figure a week ago is shown. For example, in situation report 115 (14 May 2020) and 121 (21 May 2020), there were 8676 and 5339 Total Confirmed Cases in Afghanistan, respectively, so the thick dash-dotted line passes through 477 = (8676-5339)/7 on 21 May.
For an overview of all related visualizations, and a more detailled description, see WHO Covid diagram set#Available country diagrams Jan-Aug 2020 (daily). |
| Date | |
| Source | Own work |
| Author | Jochen Burghardt |
Licensing[edit]
I, the copyright holder of this work, hereby publish it under the following license:
This file is licensed under the Creative Commons Attribution-Share Alike 4.0 International license.
- You are free:
- to share – to copy, distribute and transmit the work
- to remix – to adapt the work
- Under the following conditions:
- attribution – You must give appropriate credit, provide a link to the license, and indicate if changes were made. You may do so in any reasonable manner, but not in any way that suggests the licensor endorses you or your use.
- share alike – If you remix, transform, or build upon the material, you must distribute your contributions under the same or compatible license as the original.
Gnuplot source code[edit]
| Gnuplot source code |
|---|
set term pdf size 22,13
set term pdf font "sans,20"
set output "WHO_Covid_C_UAE.pdf"
set key autotitle columnhead
set termoption noenhanced
# (1) norm: 642 883 361 001
# (2) dist: 1,0:138 2,0:178 2,1:245
# (3,4) dist max: 245 2:361--1:883
# (4) right: 1 1 0 1
# (6,7) scMax: 375 900
# (8) scale: [1:100] [1:1] [1:1] [1:1]


set xrange [-1:212]
set yrange [0:375]
set y2range [0:900]
set xtics 3650,100
set ytics 50 textcolor "#e51e10"
set y2tics 100 textcolor "#0072b2"
set grid y y2

set title "UAE"

$data <<EOF
rep day "confirmed [1:100]" "-~confirmed [1:1]" "deaths [1:1]" "-~deaths [1:1]"
1	Jan	.	-	.	-
2	""	.	-	.	-
3	""	.	-	.	-
-	-	-	-	-	-
4	""	.	-	.	-
5	25	.	-	.	-
6	""	.	-	.	-
7	""	.	-	.	-
8	""	.	-	.	-
9	""	4	-	.	-
10	""	4	-	.	-
11	""	4	-	.	-
12	Feb	4	-	.	-
13	""	5	-	.	-
14	""	5	-	0	-
15	""	5	-	0	-
16	05	5	1	0	-
17	""	5	0	0	-
18	""	5	0	0	-
19	""	7	0	0	-
20	""	7	1	0	-
21	10	7	0	0	0
22	""	8	0	0	0
23	""	8	1	0	0
24	""	8	0	0	0
25	""	8	1	0	0
26	15	8	0	0	0
27	""	8	0	0	0
28	""	9	0	0	0
29	""	9	0	0	0
30	""	9	0	0	0
31	20	9	1	0	0
32	""	9	0	0	0
33	""	11	0	0	0
34	""	13	1	0	0
35	""	13	0	0	0
36	25	13	1	0	0
37	""	13	1	0	0
38	""	13	0	0	0
39	""	19	2	0	0
40	""	19	1	0	0
41	Mar	19	1	0	0
42	""	21	1	0	0
43	""	21	1	0	0
44	""	27	2	0	0
45	05	27	2	0	0
46	""	27	1	0	0
47	""	45	4	0	0
48	""	45	3	0	0
49	""	45	4	0	0
50	10	59	5	0	0
51	""	74	7	0	0
52	""	74	7	0	0
53	""	85	8	0	0
54	""	85	6	0	0
55	15	85	5	0	0
56	""	98	8	0	0
57	""	98	6	0	0
58	""	98	3	0	0
59	""	113	6	0	0
60	20	140	7	0	0
61	""	140	8	0	0
62	""	153	10	2	0
63	""	153	8	2	1
64	""	198	14	2	0
65	25	248	22	2	0
66	""	333	31	2	0
67	""	333	28	2	1
68	""	405	37	2	0
69	""	468	45	2	0
70	""	570	60	3	0
71	""	611	59	5	1
72	Apr	664	59	6	0
73	""	814	69	8	1
74	""	1024	99	8	1
75	""	1264	123	9	1
76	05	1505	148	10	1
77	""	1799	175	10	1
78	""	2076	210	11	1
79	""	2359	242	12	1
80	""	2659	263	12	0
81	10	2990	281	14	1
82	""	3360	300	16	1
83	""	3736	318	20	2
84	""	4123	332	22	1
85	""	4521	350	25	2
86	15	4933	367	28	3
87	""	5365	387	33	3
88	""	5825	405	35	3
89	""	6302	420	37	3
90	""	6302	367	37	2
91	20	6781	379	41	3
92	""	7265	392	43	2
93	""	7755	404	46	3
94	""	8238	410	52	3
95	""	8756	419	56	3
96	25	9281	425	64	3
97	""	9813	502	71	5
98	""	10349	510	76	5
99	""	10839	510	82	6
100	""	11380	518	89	6
101	""	11929	527	98	7
102	May	12481	532	105	7
103	""	13038	537	111	6
104	""	13599	541	119	7
105	""	14163	545	126	7
106	05	14730	556	137	8
107	""	15192	544	146	8
108	""	15738	544	157	9
109	""	16240	537	165	8
110	""	16793	537	174	9
111	10	17417	545	185	10
112	""	18198	577	198	10
113	""	18878	592	201	9
114	""	19661	639	203	8
115	""	20386	664	206	7
116	15	21084	692	208	6
117	""	21831	719	210	6
118	""	22627	745	214	4
119	""	23358	737	220	3
120	""	25063	883	227	4
121	20	25063	772	227	3
122	""	26004	803	233	4
123	""	26898	830	237	4
124	""	27892	866	241	4
125	""	28704	868	244	5
126	25	29485	876	245	3
127	""	30307	749	248	3
128	""	31086	860	253	4
129	""	31969	852	255	3
130	""	32532	805	258	3
131	""	33170	754	260	3
132	""	33896	742	262	2
133	Jun	34557	724	264	3
134	""	35192	698	266	3
135	""	35788	672	269	2
136	""	36359	627	270	2
137	05	37018	641	273	2
138	""	37642	639	274	2
139	""	38268	624	275	2
140	""	38808	608	276	2
141	""	39376	597	281	2
142	10	39904	588	283	2
143	""	40507	593	284	2
144	""	40986	567	286	2
145	""	41499	551	287	2
146	""	41990	532	288	2
147	15	42294	498	289	1
148	""	42636	465	291	2
149	""	42982	440	293	1
150	""	43364	408	295	2
151	""	43752	395	298	2
152	20	44145	378	300	1
153	""	44533	364	301	2
154	""	44925	375	302	2
155	""	45303	381	303	2
156	""	45683	386	305	2
157	25	46133	396	307	1
158	""	46563	401	308	2
159	""	46973	404	310	1
160	""	47360	404	311	2
161	""	47797	411	313	1
162	""	48246	420	314	2
163	Jul	48667	426	315	1
164	""	49069	420	316	1
165	""	49469	415	317	2
166	""	50141	452	318	1
167	05	50857	500	321	1
168	""	51540	535	323	2
169	""	52068	546	324	1
170	""	52600	562	326	2
171	""	53045	568	327	1
172	10	53577	586	328	2
173	""	54050	559	329	1
174	""	54453	514	331	2
175	""	54854	473	333	1
176	""	55198	447	334	2
177	15	55573	425	335	1
178	""	55848	400	335	1
179	""	56129	365	335	1
180	""	56422	339	337	1
181	""	56711	322	338	1
182	20	56922	296	339	1
183	""	57193	285	340	1
184	""	57498	275	341	1
185	""	57734	269	342	1
186	""	57988	266	342	1
187	25	58249	261	343	1
188	""	58562	264	343	0
189	""	58913	285	344	1
190	""	59177	283	345	1
191	""	59546	293	347	1
192	""	59921	312	347	0
193	""	60223	319	349	1
194	Aug	60506	323	351	2
195	""	60760	314	351	1
196	""	60999	298	351	1
197	""	61163	283	351	1
198	05	61352	258	351	0
199	""	61860	277	355	1
200	""	61845	232	354	1
201	""	62061	222	356	1
202	""	62300	220	356	0
203	10	62525	218	357	1
204	""	62704	220	357	1
205	""	62966	231	357	1
206	""	63212	193	358	0
207	""	63489	235	358	1
208	15	63819	251	359	0
209	""	64102	258	361	1
EOF

# confirmed:
set label "64102  " at first 209,641*375/900   left back textcolor "#8080ff"
# -~confirmed:
set label "258    " at first 209,258*375/900   left back textcolor "#8080ff"
set label "883    " at first 120,883*375/900+4 left back textcolor "#8080ff"
# deaths:
set label "361    " at first 209,361           left back textcolor "#ff8080"
# -~deaths:
set label "1      " at first 209,  1*375/900   left back textcolor "#8080ff"
set label "10     " at first 111, 10*375/900+4 left back textcolor "#8080ff"

set multiplot
  plot $data using 0:($3/    100*375/900) with lines lc 6 lw 8 dt 1 title at 0.150, 0.920
replot $data using 0:($4/      1*375/900) with lines lc 6 lw 8 dt 4 title at 0.150, 0.902
replot $data using 0:($5/      1        ) with lines lc 7 lw 5 dt 2 title at 0.150, 0.884
replot $data using 0:($6/      1*375/900) with lines lc 6 lw 5 dt 3 title at 0.150, 0.866

# plot hor axis calendar
replot $data using 0:(0):xticlabel(2) with lines
|
File history
Click on a date/time to view the file as it appeared at that time.
| Date/Time | Thumbnail | Dimensions | User | Comment | |
|---|---|---|---|---|---|
| current | 19:43, 24 September 2020 |  | 3,300 × 1,950 (25 KB) | Jochen Burghardt (talk | contribs) | =={{int:filedesc}}== {{Information |description={{en|1=Diagram of WHO COVID-19 daily data (20 Jan - 16 Aug 2020) for ''"Total Confirmed Cases"'' (thick solid line), its smoothed increment (thick dash-dotted line), ''"Total Deaths"'' (thin dashed line), and its smoothed increment (thin dotted line); see File:WHO_Covid_2020_Jan-Aug_daily_C_Afghanistan.pdf for details.}} |date=2020-09-24 |source={{own}} |author=Jochen Burghardt |permission= |other_versions=[[:File:... |
You cannot overwrite this file.
File usage on Commons
There are no pages that use this file.