File:WHO Covid 2020 Jan-Aug daily C Sweden.pdf
Jump to navigation
Jump to search

Size of this JPG preview of this PDF file: 800 × 473 pixels. Other resolutions: 320 × 189 pixels | 640 × 378 pixels | 1,024 × 605 pixels | 1,280 × 756 pixels | 3,300 × 1,950 pixels.
Original file (3,300 × 1,950 pixels, file size: 25 KB, MIME type: application/pdf)
Captions
Captions
Add a one-line explanation of what this file represents
Summary[edit]
| Description |
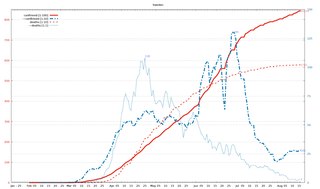
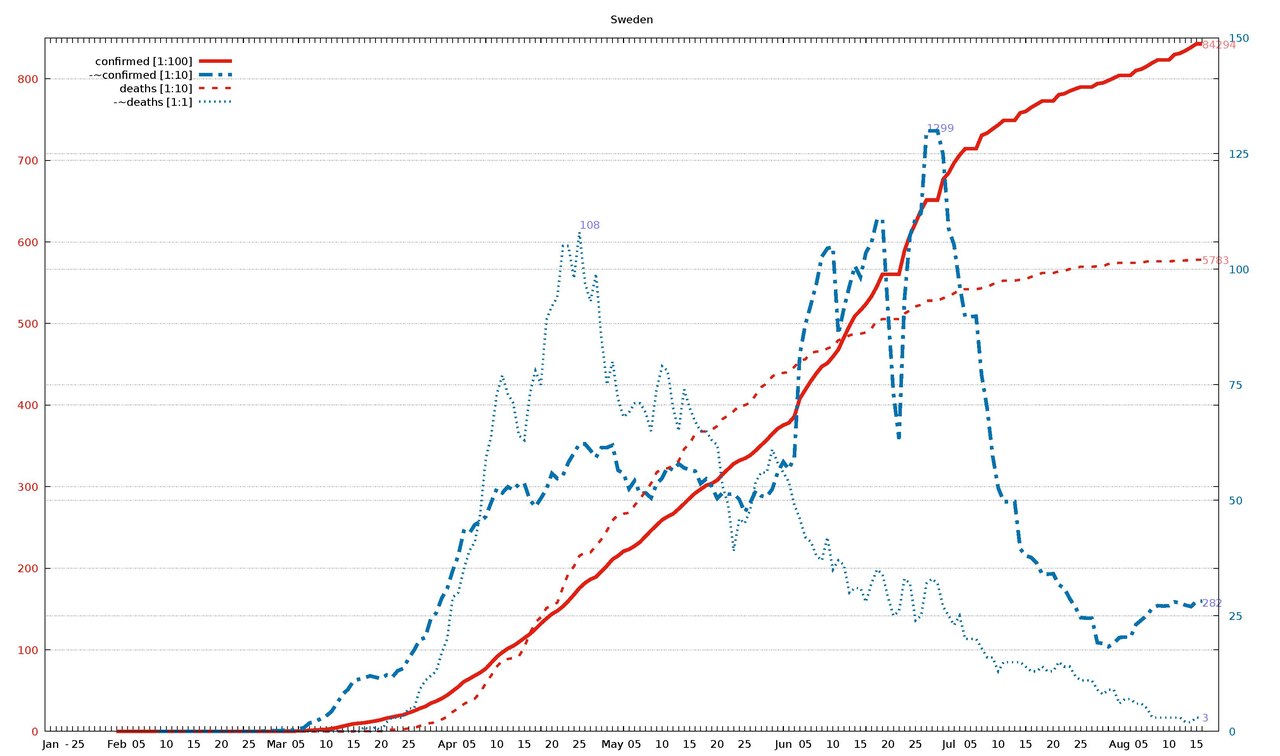
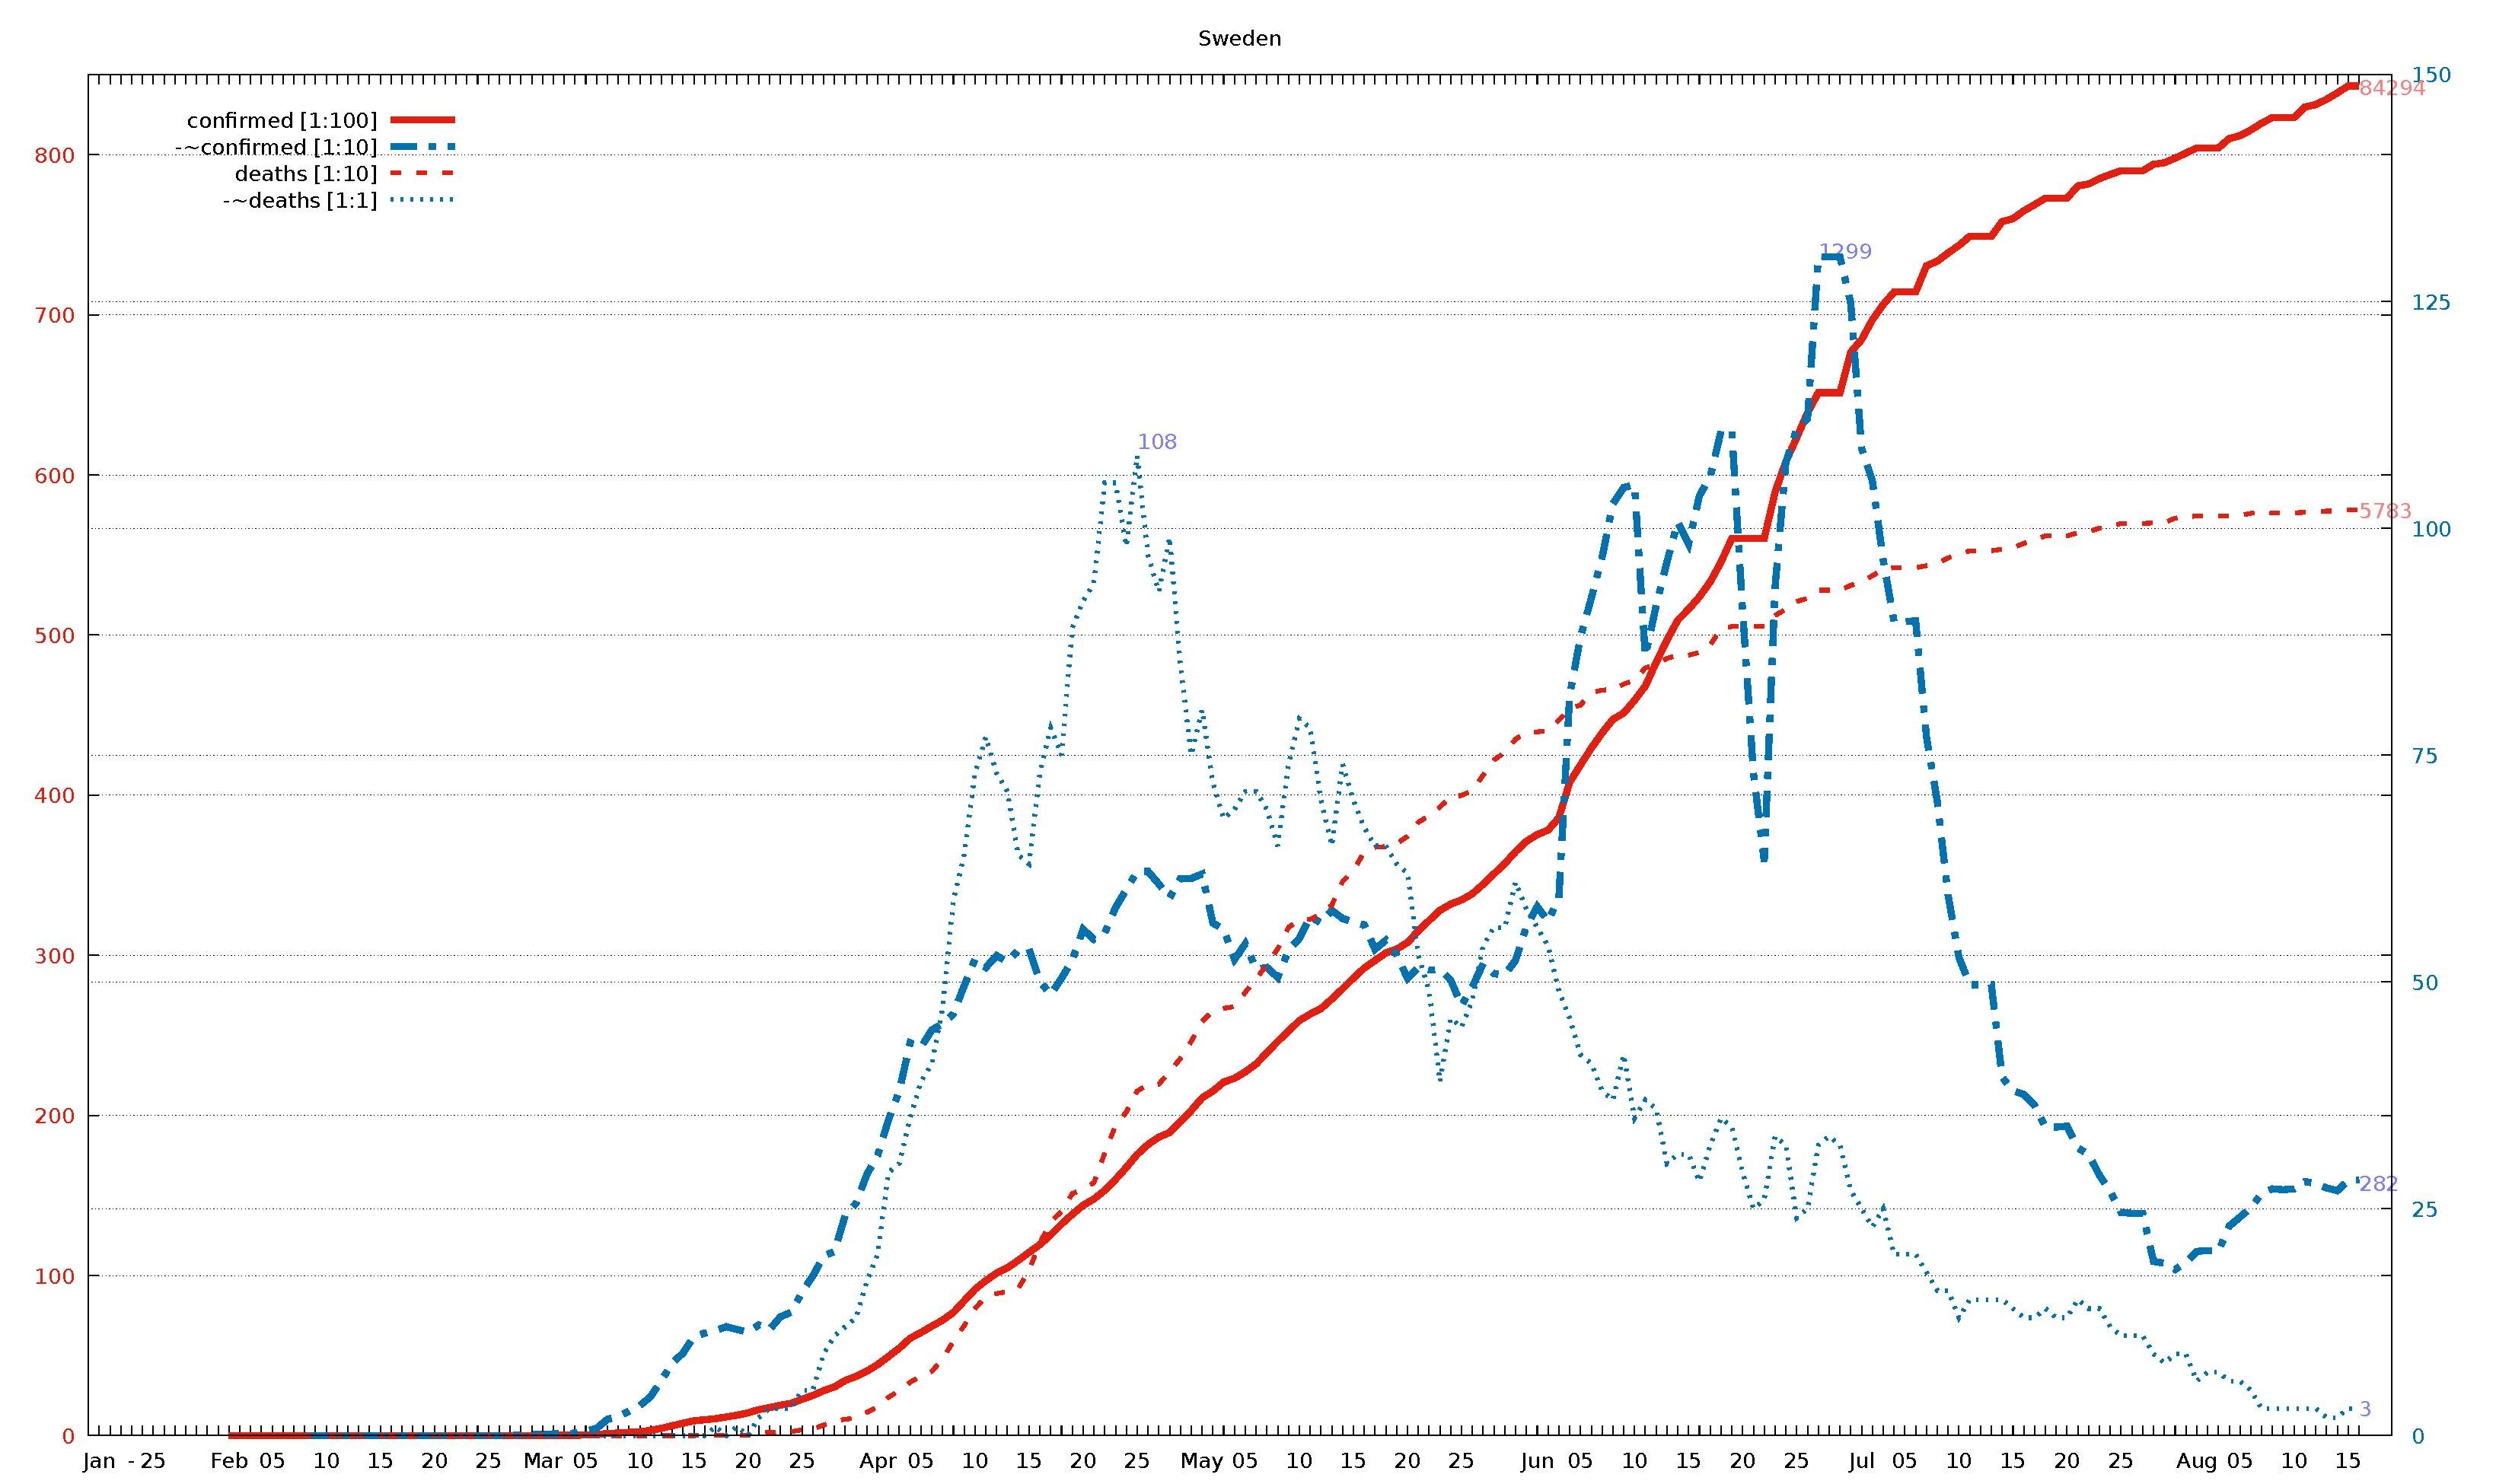
English: Diagram of WHO COVID-19 daily data (20 Jan - 16 Aug 2020) for "Total Confirmed Cases" (thick solid line), its smoothed increment (thick dash-dotted line), "Total Deaths" (thin dashed line) , and its smoothed increment (thin dotted line). Figures are taken from the available situation reports. Red and blue lines refer to the left and right vertical axis, respectively; the scaling factor for each curve is given in the legend. The horizontal axis starts on 20 Jan 2020 (situation report 1), and ends on 16 Aug 2020 (situation report 209). In the smoothed curves, for each day, 1/7 of the difference of the current day's figure and the figure a week ago is shown. For example, in situation report 115 (14 May 2020) and 121 (21 May 2020), there were 8676 and 5339 Total Confirmed Cases in Afghanistan, respectively, so the thick dash-dotted line passes through 477 = (8676-5339)/7 on 21 May.
For an overview of all related visualizations, and a more detailled description, see WHO Covid diagram set#Available country diagrams Jan-Aug 2020 (daily). |
| Date | |
| Source | Own work |
| Author | Jochen Burghardt |
Licensing[edit]
I, the copyright holder of this work, hereby publish it under the following license:
This file is licensed under the Creative Commons Attribution-Share Alike 4.0 International license.
- You are free:
- to share – to copy, distribute and transmit the work
- to remix – to adapt the work
- Under the following conditions:
- attribution – You must give appropriate credit, provide a link to the license, and indicate if changes were made. You may do so in any reasonable manner, but not in any way that suggests the licensor endorses you or your use.
- share alike – If you remix, transform, or build upon the material, you must distribute your contributions under the same or compatible license as the original.
Gnuplot source code[edit]
| Gnuplot source code |
|---|
set term pdf size 22,13
set term pdf font "sans,20"
set output "WHO_Covid_C_Sweden.pdf"
set key autotitle columnhead
set termoption noenhanced
# (1) norm: 843 130 579 108
# (2) dist: 1,0:154 2,0:146 2,1:224 3,0:128 3,1:121 3,2:186
# (3,4) dist max: 224 2:579--1:130
# (4) right: 0 1 0 1
# (6,7) scMax: 850 150
# (8) scale: [1:100] [1:10] [1:10] [1:1]


set xrange [-1:212]
set yrange [0:850]
set y2range [0:150]
set xtics 3650,100
set ytics 100 textcolor "#e51e10"
set y2tics 25 textcolor "#0072b2"
set grid y y2

set title "Sweden"

$data <<EOF
rep day "confirmed [1:100]" "-~confirmed [1:10]" "deaths [1:10]" "-~deaths [1:1]"
1	Jan	.	-	.	-
2	""	.	-	.	-
3	""	.	-	.	-
-	-	-	-	-	-
4	""	.	-	.	-
5	25	.	-	.	-
6	""	.	-	.	-
7	""	.	-	.	-
8	""	.	-	.	-
9	""	.	-	.	-
10	""	.	-	.	-
11	""	.	-	.	-
12	Feb	1	-	.	-
13	""	1	-	.	-
14	""	1	-	0	-
15	""	1	-	0	-
16	05	1	-	0	-
17	""	1	-	0	-
18	""	1	-	0	-
19	""	1	0	0	-
20	""	1	0	0	-
21	10	1	0	0	0
22	""	1	0	0	0
23	""	1	0	0	0
24	""	1	0	0	0
25	""	1	0	0	0
26	15	1	0	0	0
27	""	1	0	0	0
28	""	1	0	0	0
29	""	1	0	0	0
30	""	1	0	0	0
31	20	1	0	0	0
32	""	1	0	0	0
33	""	1	0	0	0
34	""	1	0	0	0
35	""	1	0	0	0
36	25	1	0	0	0
37	""	1	0	0	0
38	""	2	0	0	0
39	""	7	1	0	0
40	""	12	2	0	0
41	Mar	13	1	0	0
42	""	14	2	0	0
43	""	15	2	0	0
44	""	24	3	0	0
45	05	35	5	0	0
46	""	61	8	0	0
47	""	137	18	0	0
48	""	161	21	0	0
49	""	203	27	0	0
50	10	248	33	0	0
51	""	326	43	0	0
52	""	461	61	0	0
53	""	620	80	0	0
54	""	775	91	0	0
55	15	924	109	0	0
56	""	992	113	3	0
57	""	1059	116	3	1
58	""	1167	120	3	0
59	""	1279	117	3	1
60	20	1423	114	3	0
61	""	1623	122	16	2
62	""	1746	117	20	3
63	""	1906	131	21	3
64	""	2016	136	25	3
65	25	2272	158	36	5
66	""	2510	176	42	5
67	""	2806	198	66	9
68	""	3046	203	92	11
69	""	3447	243	102	12
70	""	3700	256	110	13
71	""	4028	288	146	17
72	Apr	4435	309	180	20
73	""	4947	348	239	29
74	""	5466	380	282	30
75	""	6078	433	333	35
76	05	6443	428	373	39
77	""	6830	447	401	41
78	""	7206	454	477	47
79	""	7693	465	591	59
80	""	8419	496	687	64
81	10	9141	525	793	73
82	""	9685	516	870	77
83	""	10151	529	887	73
84	""	10483	522	899	71
85	""	10948	535	919	64
86	15	11445	536	1033	63
87	""	11927	501	1203	73
88	""	12540	486	1333	78
89	""	13216	504	1400	75
90	""	13822	524	1511	89
91	20	14385	558	1540	92
92	""	14777	547	1580	94
93	""	15322	554	1765	105
94	""	16004	582	1937	105
95	""	16755	602	2021	98
96	25	17567	622	2152	108
97	""	18177	622	2192	97
98	""	18640	608	2194	93
99	""	18926	593	2274	99
100	""	19621	614	2355	85
101	""	20302	614	2462	75
102	May	21092	619	2586	80
103	""	21520	565	2653	72
104	""	22082	558	2669	68
105	""	22317	525	2679	69
106	05	22721	542	2769	71
107	""	23216	514	2854	71
108	""	23918	516	2941	69
109	""	24623	505	3040	65
110	""	25265	535	3175	74
111	10	25921	548	3220	79
112	""	26322	572	3225	78
113	""	26670	565	3256	70
114	""	27272	579	3313	65
115	""	27909	570	3460	74
116	15	28582	566	3529	70
117	""	29207	563	3646	67
118	""	29677	536	3674	65
119	""	30143	546	3679	65
120	""	30377	530	3698	63
121	20	30799	504	3743	62
122	""	31523	516	3831	53
123	""	32172	513	3871	49
124	""	32809	514	3925	39
125	""	33188	502	3992	46
126	25	33459	474	3998	45
127	""	33843	495	4029	48
128	""	34440	520	4125	54
129	""	35088	509	4220	56
130	""	35727	508	4266	56
131	""	36476	524	4350	61
132	""	37113	561	4395	58
133	Jun	37542	583	4395	56
134	""	37814	567	4403	54
135	""	38589	593	4468	49
136	""	40803	816	4542	46
137	05	41883	880	4562	42
138	""	42939	923	4639	41
139	""	43887	968	4656	38
140	""	44730	1027	4659	37
141	""	45133	1045	4694	42
142	10	45924	1048	4717	35
143	""	46814	859	4795	37
144	""	48288	915	4814	36
145	""	49684	963	4854	30
146	""	50931	1007	4874	31
147	15	51614	983	4874	31
148	""	52383	1036	4891	28
149	""	53323	1057	4939	32
150	""	54562	1107	5041	35
151	""	56043	1108	5053	34
152	20	56043	908	5053	29
153	""	56043	730	5053	25
154	""	56043	633	5053	26
155	""	58932	936	5122	33
156	""	60837	1073	5161	32
157	25	62324	1109	5209	24
158	""	63890	1121	5230	25
159	""	65137	1299	5280	32
160	""	65137	1299	5280	33
161	""	65137	1299	5280	32
162	""	67667	1248	5310	27
163	Jul	68451	1088	5333	25
164	""	69692	1052	5370	23
165	""	70639	965	5411	25
166	""	71419	897	5420	20
167	05	71419	897	5420	20
168	""	71419	898	5420	20
169	""	73061	770	5433	18
170	""	73344	699	5447	16
171	""	73858	596	5482	16
172	10	74333	527	5500	13
173	""	74898	497	5526	15
174	""	74898	497	5526	15
175	""	74898	497	5526	15
176	""	75826	395	5536	15
177	15	76001	380	5545	14
178	""	76492	376	5572	13
179	""	76877	364	5593	13
180	""	77281	340	5619	14
181	""	77281	340	5619	13
182	20	77281	341	5619	13
183	""	78048	317	5639	15
184	""	78166	310	5646	14
185	""	78504	287	5667	14
186	""	78763	269	5676	12
187	25	78997	246	5697	11
188	""	78997	245	5697	11
189	""	78997	245	5697	11
190	""	79395	192	5700	9
191	""	79494	190	5702	8
192	""	79782	183	5730	9
193	""	80100	191	5739	9
194	Aug	80422	203	5743	6
195	""	80422	204	5743	7
196	""	80422	203	5743	7
197	""	81012	231	5744	6
198	05	81181	241	5747	6
199	""	81540	251	5760	5
200	""	81967	267	5766	3
201	""	82323	272	5763	3
202	""	82323	271	5763	3
203	10	82323	272	5763	3
204	""	82972	280	5766	3
205	""	83126	278	5770	3
206	""	83455	273	5774	2
207	""	83852	270	5776	2
208	15	84294	281	5783	3
209	""	84294	282	5783	3
EOF

# confirmed:
set label "84294  " at first 209,842           left back textcolor "#ff8080"
# -~confirmed:
set label "282    " at first 209, 28*850/150   left back textcolor "#8080ff"
set label "1299   " at first 159,129*850/150+9 left back textcolor "#8080ff"
# deaths:
set label "5783   " at first 209,578           left back textcolor "#ff8080"
# -~deaths:
set label "3      " at first 209,  3*850/150   left back textcolor "#8080ff"
set label "108    " at first  96,108*850/150+9 left back textcolor "#8080ff"

set multiplot
  plot $data using 0:($3/    100        ) with lines lc 7 lw 8 dt 1 title at 0.150, 0.920
replot $data using 0:($4/     10*850/150) with lines lc 6 lw 8 dt 4 title at 0.150, 0.902
replot $data using 0:($5/     10        ) with lines lc 7 lw 5 dt 2 title at 0.150, 0.884
replot $data using 0:($6/      1*850/150) with lines lc 6 lw 5 dt 3 title at 0.150, 0.866

# plot hor axis calendar
replot $data using 0:(0):xticlabel(2) with lines
|
File history
Click on a date/time to view the file as it appeared at that time.
| Date/Time | Thumbnail | Dimensions | User | Comment | |
|---|---|---|---|---|---|
| current | 19:39, 24 September 2020 |  | 3,300 × 1,950 (25 KB) | Jochen Burghardt (talk | contribs) | =={{int:filedesc}}== {{Information |description={{en|1=Diagram of WHO COVID-19 daily data (20 Jan - 16 Aug 2020) for ''"Total Confirmed Cases"'' (thick solid line), its smoothed increment (thick dash-dotted line), ''"Total Deaths"'' (thin dashed line), and its smoothed increment (thin dotted line); see File:WHO_Covid_2020_Jan-Aug_daily_C_Afghanistan.pdf for details.}} |date=2020-09-24 |source={{own}} |author=Jochen Burghardt |permission= |other_versions=[[:File:... |
You cannot overwrite this file.
File usage on Commons
There are no pages that use this file.