File:WHO Covid 2020 Jan-Aug daily C Sudan.pdf
Jump to navigation
Jump to search

Size of this JPG preview of this PDF file: 800 × 473 pixels. Other resolutions: 320 × 189 pixels | 640 × 378 pixels | 1,024 × 605 pixels | 1,280 × 756 pixels | 3,300 × 1,950 pixels.
Original file (3,300 × 1,950 pixels, file size: 23 KB, MIME type: application/pdf)
Captions
Captions
Add a one-line explanation of what this file represents
Summary[edit]
| Description |
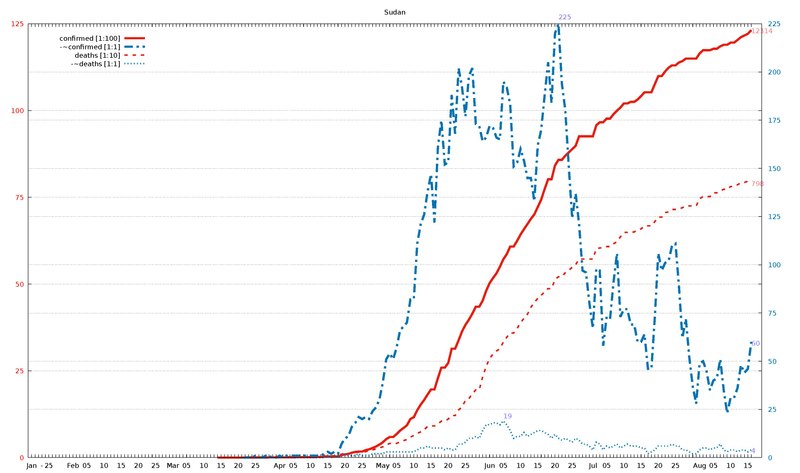
English: Diagram of WHO COVID-19 daily data (20 Jan - 16 Aug 2020) for "Total Confirmed Cases" (thick solid line), its smoothed increment (thick dash-dotted line), "Total Deaths" (thin dashed line) , and its smoothed increment (thin dotted line). Figures are taken from the available situation reports. Red and blue lines refer to the left and right vertical axis, respectively; the scaling factor for each curve is given in the legend. The horizontal axis starts on 20 Jan 2020 (situation report 1), and ends on 16 Aug 2020 (situation report 209). In the smoothed curves, for each day, 1/7 of the difference of the current day's figure and the figure a week ago is shown. For example, in situation report 115 (14 May 2020) and 121 (21 May 2020), there were 8676 and 5339 Total Confirmed Cases in Afghanistan, respectively, so the thick dash-dotted line passes through 477 = (8676-5339)/7 on 21 May.
For an overview of all related visualizations, and a more detailled description, see WHO Covid diagram set#Available country diagrams Jan-Aug 2020 (daily). |
| Date | |
| Source | Own work |
| Author | Jochen Burghardt |
Licensing[edit]
I, the copyright holder of this work, hereby publish it under the following license:
This file is licensed under the Creative Commons Attribution-Share Alike 4.0 International license.
- You are free:
- to share – to copy, distribute and transmit the work
- to remix – to adapt the work
- Under the following conditions:
- attribution – You must give appropriate credit, provide a link to the license, and indicate if changes were made. You may do so in any reasonable manner, but not in any way that suggests the licensor endorses you or your use.
- share alike – If you remix, transform, or build upon the material, you must distribute your contributions under the same or compatible license as the original.
Gnuplot source code[edit]
| Gnuplot source code |
|---|
set term pdf size 22,13
set term pdf font "sans,20"
set output "WHO_Covid_C_Sudan.pdf"
set key autotitle columnhead
set termoption noenhanced
# (1) norm: 124 225 798 001
# (2) dist: 1,0:182 2,0:155 2,1:281
# (3,4) dist max: 281 2:798--1:225
# (4) right: 0 1 0 1
# (6,7) scMax: 125 225
# (8) scale: [1:100] [1:1] [1:10] [1:1]


set xrange [-1:212]
set yrange [0:125]
set y2range [0:225]
set xtics 3650,100
set ytics 25 textcolor "#e51e10"
set y2tics 25 textcolor "#0072b2"
set grid y y2

set title "Sudan"

$data <<EOF
rep day "confirmed [1:100]" "-~confirmed [1:1]" "deaths [1:10]" "-~deaths [1:1]"
1	Jan	.	-	.	-
2	""	.	-	.	-
3	""	.	-	.	-
-	-	-	-	-	-
4	""	.	-	.	-
5	25	.	-	.	-
6	""	.	-	.	-
7	""	.	-	.	-
8	""	.	-	.	-
9	""	.	-	.	-
10	""	.	-	.	-
11	""	.	-	.	-
12	Feb	.	-	.	-
13	""	.	-	.	-
14	""	.	-	.	-
15	""	.	-	.	-
16	05	.	-	.	-
17	""	.	-	.	-
18	""	.	-	.	-
19	""	.	-	.	-
20	""	.	-	.	-
21	10	.	-	.	-
22	""	.	-	.	-
23	""	.	-	.	-
24	""	.	-	.	-
25	""	.	-	.	-
26	15	.	-	.	-
27	""	.	-	.	-
28	""	.	-	.	-
29	""	.	-	.	-
30	""	.	-	.	-
31	20	.	-	.	-
32	""	.	-	.	-
33	""	.	-	.	-
34	""	.	-	.	-
35	""	.	-	.	-
36	25	.	-	.	-
37	""	.	-	.	-
38	""	.	-	.	-
39	""	.	-	.	-
40	""	.	-	.	-
41	Mar	.	-	.	-
42	""	.	-	.	-
43	""	.	-	.	-
44	""	.	-	.	-
45	05	.	-	.	-
46	""	.	-	.	-
47	""	.	-	.	-
48	""	.	-	.	-
49	""	.	-	.	-
50	10	.	-	.	-
51	""	.	-	.	-
52	""	.	-	.	-
53	""	.	-	.	-
54	""	1	-	0	-
55	15	1	-	0	-
56	""	1	-	1	-
57	""	1	-	1	-
58	""	1	-	1	-
59	""	1	-	1	-
60	20	1	-	1	-
61	""	1	0	1	0
62	""	2	0	1	0
63	""	2	0	1	0
64	""	2	0	1	0
65	25	3	1	1	0
66	""	3	0	1	0
67	""	3	0	1	0
68	""	3	1	1	0
69	""	5	0	1	0
70	""	6	1	2	0
71	""	6	0	2	0
72	Apr	7	1	2	0
73	""	7	0	2	1
74	""	8	1	2	0
75	""	10	1	2	0
76	05	10	1	2	0
77	""	12	1	2	0
78	""	14	1	2	0
79	""	14	1	2	0
80	""	14	1	2	0
81	10	15	1	2	0
82	""	17	1	2	0
83	""	19	1	2	0
84	""	19	1	2	0
85	""	29	2	4	0
86	15	32	3	5	1
87	""	32	2	5	0
88	""	32	3	5	1
89	""	33	2	6	0
90	""	66	7	10	1
91	20	92	10	12	2
92	""	107	11	12	1
93	""	140	16	13	1
94	""	162	18	13	1
95	""	174	21	16	2
96	25	174	20	16	1
97	""	213	21	17	1
98	""	237	20	21	1
99	""	275	24	22	2
100	""	318	26	25	2
101	""	375	30	28	2
102	May	442	39	31	2
103	""	533	51	36	3
104	""	592	54	41	3
105	""	592	51	41	3
106	05	678	57	41	3
107	""	778	66	45	3
108	""	852	68	49	3
109	""	930	70	52	3
110	""	1111	82	59	3
111	10	1164	82	64	3
112	""	1365	111	70	4
113	""	1526	121	74	5
114	""	1660	126	80	5
115	""	1817	138	90	6
116	15	1964	147	91	5
117	""	1964	122	91	5
118	""	2289	161	97	5
119	""	2591	175	105	5
120	""	2591	152	105	4
121	20	2728	153	111	5
122	""	3138	188	121	4
123	""	3138	168	121	4
124	""	3378	202	137	7
125	""	3634	192	146	7
126	25	3826	177	165	8
127	""	3976	198	170	10
128	""	4146	202	184	10
129	""	4346	173	195	11
130	""	4346	172	195	10
131	""	4521	164	233	14
132	""	4800	166	262	17
133	Jun	5026	172	286	17
134	""	5173	171	298	18
135	""	5310	166	307	18
136	""	5499	165	314	17
137	05	5714	195	333	19
138	""	5865	192	347	17
139	""	6081	183	359	14
140	""	6083	151	359	10
141	""	6244	153	372	11
142	10	6427	160	389	11
143	""	6582	154	401	13
144	""	6730	145	413	11
145	""	6879	145	433	12
146	""	7007	133	447	13
147	15	7220	162	459	14
148	""	7435	170	468	14
149	""	7740	188	477	13
150	""	8020	205	487	12
151	""	8020	184	487	10
152	20	8416	220	513	12
153	""	8580	225	521	10
154	""	8580	194	521	9
155	""	8698	180	533	10
156	""	8791	151	540	9
157	25	8889	124	548	8
158	""	8984	137	556	10
159	""	9258	121	572	9
160	""	9258	97	572	7
161	""	9258	96	572	7
162	""	9258	80	572	6
163	Jul	9258	67	572	4
164	""	9574	98	602	8
165	""	9663	97	604	7
166	""	9663	58	604	4
167	05	9767	73	608	6
168	""	9767	72	608	5
169	""	9894	91	616	6
170	""	9997	106	622	7
171	""	10084	73	636	5
172	10	10204	77	649	6
173	""	10204	77	649	7
174	""	10250	69	650	6
175	""	10250	69	650	6
176	""	10316	60	657	6
177	15	10417	60	659	5
178	""	10527	64	668	5
179	""	10527	46	668	2
180	""	10527	46	668	3
181	""	10762	73	680	4
182	20	10992	106	693	6
183	""	10992	97	693	6
184	""	11127	101	706	6
185	""	11237	102	708	6
186	""	11302	110	715	7
187	25	11302	111	715	6
188	""	11385	89	717	6
189	""	11424	62	720	4
190	""	11496	72	725	4
191	""	11496	52	725	3
192	""	11496	37	725	2
193	""	11496	28	725	2
194	Aug	11644	49	746	4
195	""	11738	50	752	5
196	""	11738	45	752	5
197	""	11738	35	752	4
198	05	11780	40	763	5
199	""	11780	41	763	5
200	""	11850	51	769	7
201	""	11894	35	773	4
202	""	11894	23	773	3
203	10	11956	31	781	4
204	""	11956	31	781	4
205	""	12033	36	786	3
206	""	12115	48	792	4
207	""	12162	44	793	4
208	15	12211	46	796	3
209	""	12314	60	798	4
EOF

# confirmed:
set label "12314  " at first 209,123           left back textcolor "#ff8080"
# -~confirmed:
set label "60     " at first 209, 60*125/225   left back textcolor "#8080ff"
set label "225    " at first 153,225*125/225+2 left back textcolor "#8080ff"
# deaths:
set label "798    " at first 209, 79           left back textcolor "#ff8080"
# -~deaths:
set label "4      " at first 209,  4*125/225   left back textcolor "#8080ff"
set label "19     " at first 137, 19*125/225+2 left back textcolor "#8080ff"

set multiplot
  plot $data using 0:($3/    100        ) with lines lc 7 lw 8 dt 1 title at 0.150, 0.920
replot $data using 0:($4/      1*125/225) with lines lc 6 lw 8 dt 4 title at 0.150, 0.902
replot $data using 0:($5/     10        ) with lines lc 7 lw 5 dt 2 title at 0.150, 0.884
replot $data using 0:($6/      1*125/225) with lines lc 6 lw 5 dt 3 title at 0.150, 0.866

# plot hor axis calendar
replot $data using 0:(0):xticlabel(2) with lines
|
File history
Click on a date/time to view the file as it appeared at that time.
| Date/Time | Thumbnail | Dimensions | User | Comment | |
|---|---|---|---|---|---|
| current | 19:39, 24 September 2020 |  | 3,300 × 1,950 (23 KB) | Jochen Burghardt (talk | contribs) | =={{int:filedesc}}== {{Information |description={{en|1=Diagram of WHO COVID-19 daily data (20 Jan - 16 Aug 2020) for ''"Total Confirmed Cases"'' (thick solid line), its smoothed increment (thick dash-dotted line), ''"Total Deaths"'' (thin dashed line), and its smoothed increment (thin dotted line); see File:WHO_Covid_2020_Jan-Aug_daily_C_Afghanistan.pdf for details.}} |date=2020-09-24 |source={{own}} |author=Jochen Burghardt |permission= |other_versions=[[:File:... |
You cannot overwrite this file.
File usage on Commons
There are no pages that use this file.