File:WHO Covid 2020 Jan-Aug daily C Slovenia.pdf
Jump to navigation
Jump to search

Size of this JPG preview of this PDF file: 800 × 473 pixels. Other resolutions: 320 × 189 pixels | 640 × 378 pixels | 1,024 × 605 pixels | 1,280 × 756 pixels | 3,300 × 1,950 pixels.
Original file (3,300 × 1,950 pixels, file size: 22 KB, MIME type: application/pdf)
Captions
Captions
Add a one-line explanation of what this file represents
Summary[edit]
| Description |
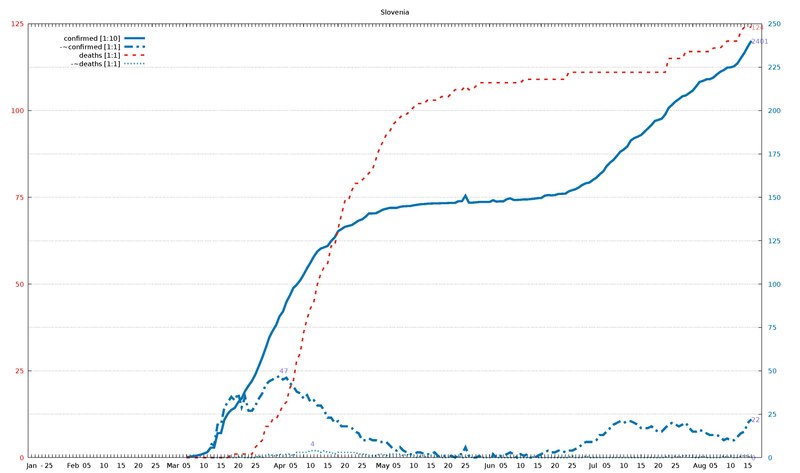
English: Diagram of WHO COVID-19 daily data (20 Jan - 16 Aug 2020) for "Total Confirmed Cases" (thick solid line), its smoothed increment (thick dash-dotted line), "Total Deaths" (thin dashed line) , and its smoothed increment (thin dotted line). Figures are taken from the available situation reports. Red and blue lines refer to the left and right vertical axis, respectively; the scaling factor for each curve is given in the legend. The horizontal axis starts on 20 Jan 2020 (situation report 1), and ends on 16 Aug 2020 (situation report 209). In the smoothed curves, for each day, 1/7 of the difference of the current day's figure and the figure a week ago is shown. For example, in situation report 115 (14 May 2020) and 121 (21 May 2020), there were 8676 and 5339 Total Confirmed Cases in Afghanistan, respectively, so the thick dash-dotted line passes through 477 = (8676-5339)/7 on 21 May.
For an overview of all related visualizations, and a more detailled description, see WHO Covid diagram set#Available country diagrams Jan-Aug 2020 (daily). |
| Date | |
| Source | Own work |
| Author | Jochen Burghardt |
Licensing[edit]
I, the copyright holder of this work, hereby publish it under the following license:
This file is licensed under the Creative Commons Attribution-Share Alike 4.0 International license.
- You are free:
- to share – to copy, distribute and transmit the work
- to remix – to adapt the work
- Under the following conditions:
- attribution – You must give appropriate credit, provide a link to the license, and indicate if changes were made. You may do so in any reasonable manner, but not in any way that suggests the licensor endorses you or your use.
- share alike – If you remix, transform, or build upon the material, you must distribute your contributions under the same or compatible license as the original.
Gnuplot source code[edit]
| Gnuplot source code |
|---|
set term pdf size 22,13
set term pdf font "sans,20"
set output "WHO_Covid_C_Slovenia.pdf"
set key autotitle columnhead
set termoption noenhanced
# (1) norm: 241 001 124 001
# (2) dist: 2,0:195
# (3,4) dist max: 195 2:124--0:241
# (4) right: 1 1 0 1
# (6,7) scMax: 125 250
# (8) scale: [1:10] [1:1] [1:1] [1:1]


set xrange [-1:212]
set yrange [0:125]
set y2range [0:250]
set xtics 3650,100
set ytics 25 textcolor "#e51e10"
set y2tics 25 textcolor "#0072b2"
set grid y y2

set title "Slovenia"

$data <<EOF
rep day "confirmed [1:10]" "-~confirmed [1:1]" "deaths [1:1]" "-~deaths [1:1]"
1	Jan	.	-	.	-
2	""	.	-	.	-
3	""	.	-	.	-
-	-	-	-	-	-
4	""	.	-	.	-
5	25	.	-	.	-
6	""	.	-	.	-
7	""	.	-	.	-
8	""	.	-	.	-
9	""	.	-	.	-
10	""	.	-	.	-
11	""	.	-	.	-
12	Feb	.	-	.	-
13	""	.	-	.	-
14	""	.	-	.	-
15	""	.	-	.	-
16	05	.	-	.	-
17	""	.	-	.	-
18	""	.	-	.	-
19	""	.	-	.	-
20	""	.	-	.	-
21	10	.	-	.	-
22	""	.	-	.	-
23	""	.	-	.	-
24	""	.	-	.	-
25	""	.	-	.	-
26	15	.	-	.	-
27	""	.	-	.	-
28	""	.	-	.	-
29	""	.	-	.	-
30	""	.	-	.	-
31	20	.	-	.	-
32	""	.	-	.	-
33	""	.	-	.	-
34	""	.	-	.	-
35	""	.	-	.	-
36	25	.	-	.	-
37	""	.	-	.	-
38	""	.	-	.	-
39	""	.	-	.	-
40	""	.	-	.	-
41	Mar	.	-	.	-
42	""	.	-	.	-
43	""	.	-	.	-
44	""	.	-	.	-
45	05	1	-	0	-
46	""	6	-	0	-
47	""	9	-	0	-
48	""	12	-	0	-
49	""	16	-	0	-
50	10	23	-	0	-
51	""	31	-	0	-
52	""	57	8	0	0
53	""	57	7	0	0
54	""	141	19	0	0
55	15	141	19	0	0
56	""	219	29	0	0
57	""	253	32	0	0
58	""	275	35	1	0
59	""	286	33	1	0
60	20	319	37	1	0
61	""	341	29	1	1
62	""	383	35	1	0
63	""	414	27	1	0
64	""	442	27	1	0
65	25	480	30	3	0
66	""	528	34	4	1
67	""	577	37	5	0
68	""	632	42	9	1
69	""	691	44	9	2
70	""	730	45	11	1
71	""	763	46	11	1
72	Apr	814	47	13	2
73	""	841	45	15	1
74	""	897	46	16	2
75	""	934	43	20	2
76	05	977	41	22	1
77	""	997	38	28	3
78	""	1021	37	30	3
79	""	1055	34	36	3
80	""	1091	36	40	3
81	10	1124	32	43	4
82	""	1160	33	45	4
83	""	1188	30	50	4
84	""	1205	30	53	3
85	""	1212	27	55	4
86	15	1220	23	56	3
87	""	1248	23	61	3
88	""	1268	20	61	2
89	""	1304	21	66	3
90	""	1317	18	70	3
91	20	1330	18	74	3
92	""	1335	18	74	3
93	""	1340	17	77	3
94	""	1353	15	79	3
95	""	1366	14	79	2
96	25	1373	10	80	2
97	""	1388	10	81	2
98	""	1407	11	82	1
99	""	1407	10	83	1
100	""	1408	10	86	1
101	""	1418	9	89	2
102	May	1429	9	91	2
103	""	1434	9	93	1
104	""	1439	7	94	2
105	""	1439	5	96	2
106	05	1439	4	97	2
107	""	1445	6	98	2
108	""	1448	4	99	1
109	""	1449	3	99	2
110	""	1450	2	100	1
111	10	1454	2	101	1
112	""	1457	3	102	0
113	""	1460	3	102	1
114	""	1461	2	102	1
115	""	1463	2	103	0
116	15	1464	2	103	1
117	""	1465	3	103	0
118	""	1465	1	103	1
119	""	1466	1	104	0
120	""	1466	1	104	0
121	20	1467	1	104	0
122	""	1468	1	105	1
123	""	1468	0	106	0
124	""	1478	2	106	1
125	""	1478	2	106	0
126	25	1509	6	107	0
127	""	1469	1	106	1
128	""	1469	0	106	0
129	""	1471	0	107	0
130	""	1473	1	108	1
131	""	1473	-1	108	0
132	""	1473	0	108	0
133	Jun	1473	-5	108	0
134	""	1483	2	108	1
135	""	1475	0	108	0
136	""	1477	1	108	0
137	05	1477	1	108	0
138	""	1489	2	108	0
139	""	1494	3	108	0
140	""	1485	2	108	0
141	""	1485	0	108	0
142	10	1486	2	108	0
143	""	1488	1	109	0
144	""	1488	2	109	0
145	""	1490	0	109	0
146	""	1492	0	109	1
147	15	1495	1	109	0
148	""	1496	2	109	0
149	""	1509	3	109	0
150	""	1513	4	109	0
151	""	1511	3	109	0
152	20	1513	3	109	0
153	""	1519	4	109	0
154	""	1520	4	109	0
155	""	1521	3	109	0
156	""	1534	4	111	0
157	25	1541	4	111	1
158	""	1547	5	111	0
159	""	1558	6	111	0
160	""	1572	8	111	0
161	""	1581	9	111	1
162	""	1585	9	111	0
163	Jul	1600	9	111	0
164	""	1613	10	111	0
165	""	1633	13	111	0
166	""	1649	13	111	0
167	05	1679	15	111	0
168	""	1700	17	111	0
169	""	1716	19	111	0
170	""	1739	20	111	0
171	""	1763	21	111	0
172	10	1776	20	111	0
173	""	1793	21	111	0
174	""	1827	21	111	0
175	""	1841	20	111	0
176	""	1849	19	111	0
177	15	1859	17	111	0
178	""	1878	17	111	0
179	""	1897	17	111	0
180	""	1916	18	111	0
181	""	1940	16	111	0
182	20	1946	15	111	0
183	""	1953	15	111	0
184	""	1977	17	111	0
185	""	2015	19	115	1
186	""	2033	20	115	0
187	25	2052	19	115	1
188	""	2066	18	115	0
189	""	2082	19	115	1
190	""	2087	20	117	1
191	""	2101	17	117	1
192	""	2115	15	117	0
193	""	2139	15	117	0
194	Aug	2165	16	117	0
195	""	2171	15	117	1
196	""	2180	14	117	0
197	""	2181	13	117	0
198	05	2190	13	118	0
199	""	2208	13	118	0
200	""	2223	12	118	0
201	""	2233	10	119	1
202	""	2247	11	120	0
203	10	2249	10	120	1
204	""	2255	10	120	0
205	""	2272	12	120	0
206	""	2303	14	123	1
207	""	2332	15	124	1
208	15	2369	20	124	1
209	""	2401	22	124	0
EOF

# confirmed:
set label "2401   " at first 209,240*125/250   left back textcolor "#8080ff"
# -~confirmed:
set label "22     " at first 209, 22*125/250   left back textcolor "#8080ff"
set label "47     " at first  72, 47*125/250+2 left back textcolor "#8080ff"
# deaths:
set label "124    " at first 209,124           left back textcolor "#ff8080"
# -~deaths:
set label "0      " at first 209,  0*125/250   left back textcolor "#8080ff"
set label "4      " at first  81,  4*125/250+2 left back textcolor "#8080ff"

set multiplot
  plot $data using 0:($3/     10*125/250) with lines lc 6 lw 8 dt 1 title at 0.150, 0.920
replot $data using 0:($4/      1*125/250) with lines lc 6 lw 8 dt 4 title at 0.150, 0.902
replot $data using 0:($5/      1        ) with lines lc 7 lw 5 dt 2 title at 0.150, 0.884
replot $data using 0:($6/      1*125/250) with lines lc 6 lw 5 dt 3 title at 0.150, 0.866

# plot hor axis calendar
replot $data using 0:(0):xticlabel(2) with lines
|
File history
Click on a date/time to view the file as it appeared at that time.
| Date/Time | Thumbnail | Dimensions | User | Comment | |
|---|---|---|---|---|---|
| current | 19:35, 24 September 2020 |  | 3,300 × 1,950 (22 KB) | Jochen Burghardt (talk | contribs) | =={{int:filedesc}}== {{Information |description={{en|1=Diagram of WHO COVID-19 daily data (20 Jan - 16 Aug 2020) for ''"Total Confirmed Cases"'' (thick solid line), its smoothed increment (thick dash-dotted line), ''"Total Deaths"'' (thin dashed line), and its smoothed increment (thin dotted line); see File:WHO_Covid_2020_Jan-Aug_daily_C_Afghanistan.pdf for details.}} |date=2020-09-24 |source={{own}} |author=Jochen Burghardt |permission= |other_versions=[[:File:... |
You cannot overwrite this file.
File usage on Commons
There are no pages that use this file.