File:WHO Covid 2020 Jan-Aug daily C Oman.pdf
Jump to navigation
Jump to search

Size of this JPG preview of this PDF file: 800 × 473 pixels. Other resolutions: 320 × 189 pixels | 640 × 378 pixels | 1,024 × 605 pixels | 1,280 × 756 pixels | 3,300 × 1,950 pixels.
Original file (3,300 × 1,950 pixels, file size: 24 KB, MIME type: application/pdf)
Captions
Captions
Add a one-line explanation of what this file represents
Summary[edit]
| Description |
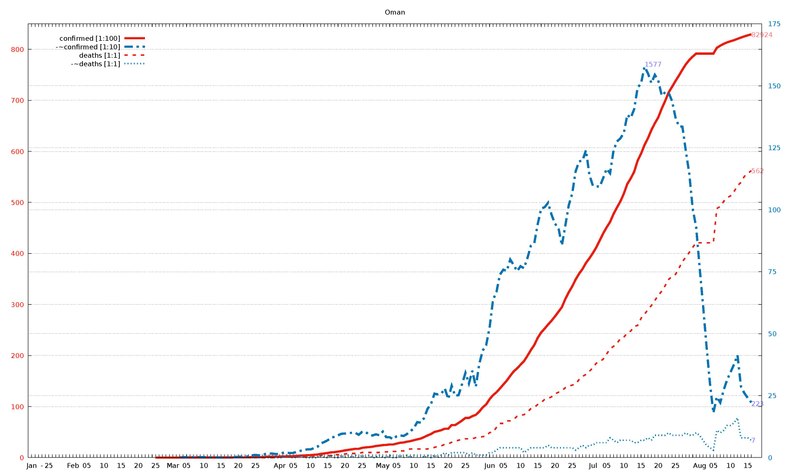
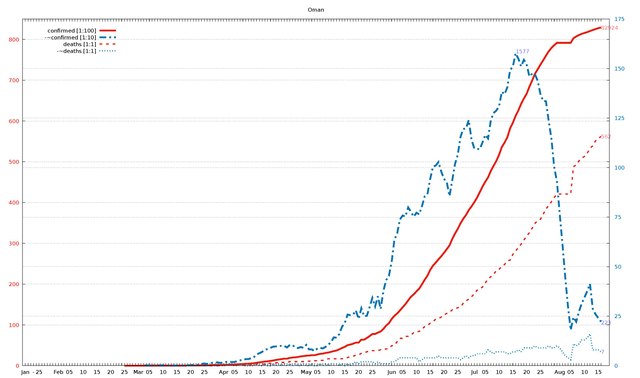
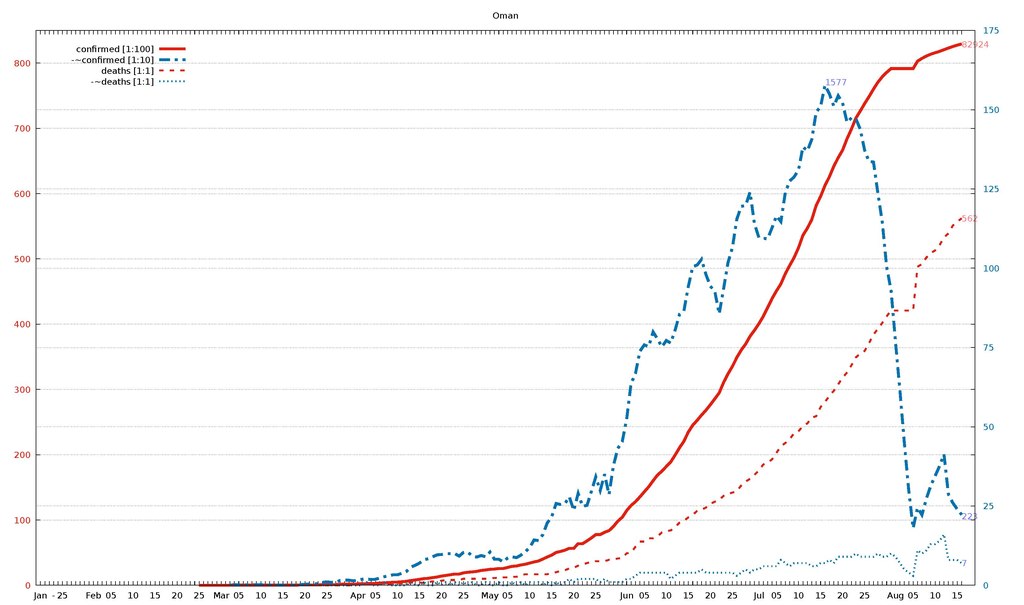
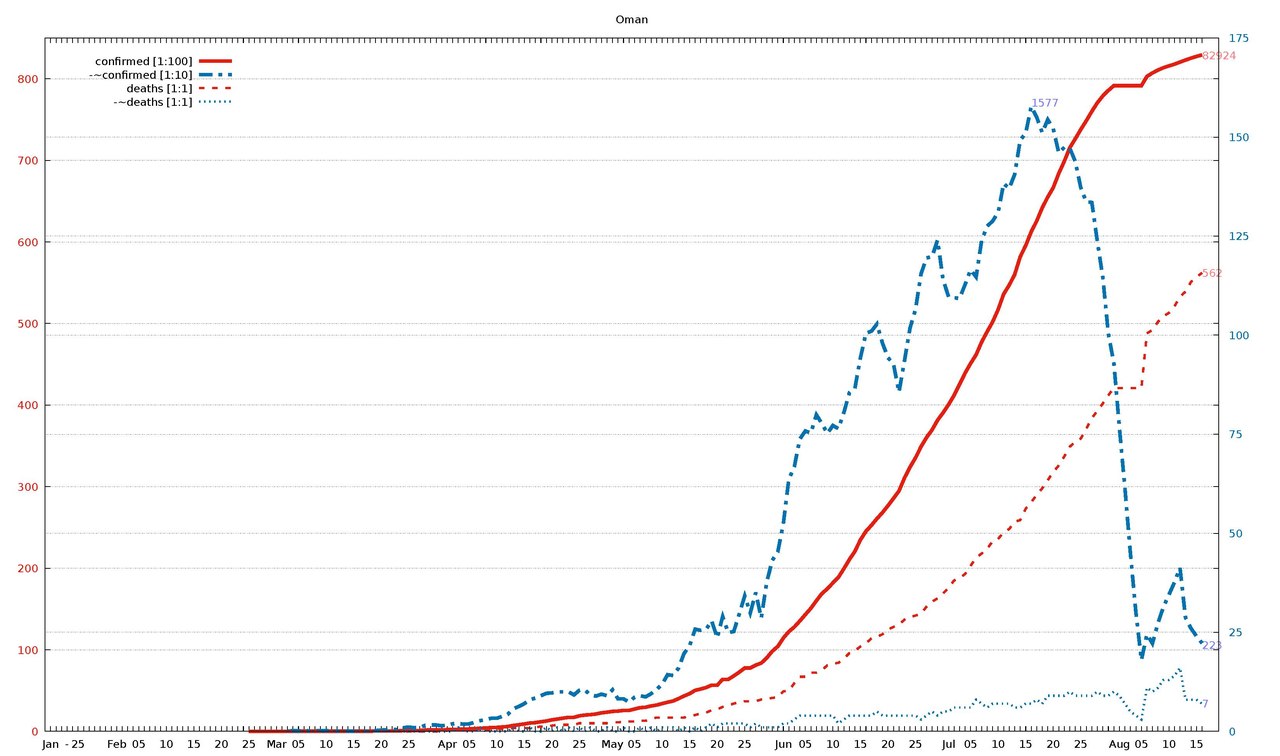
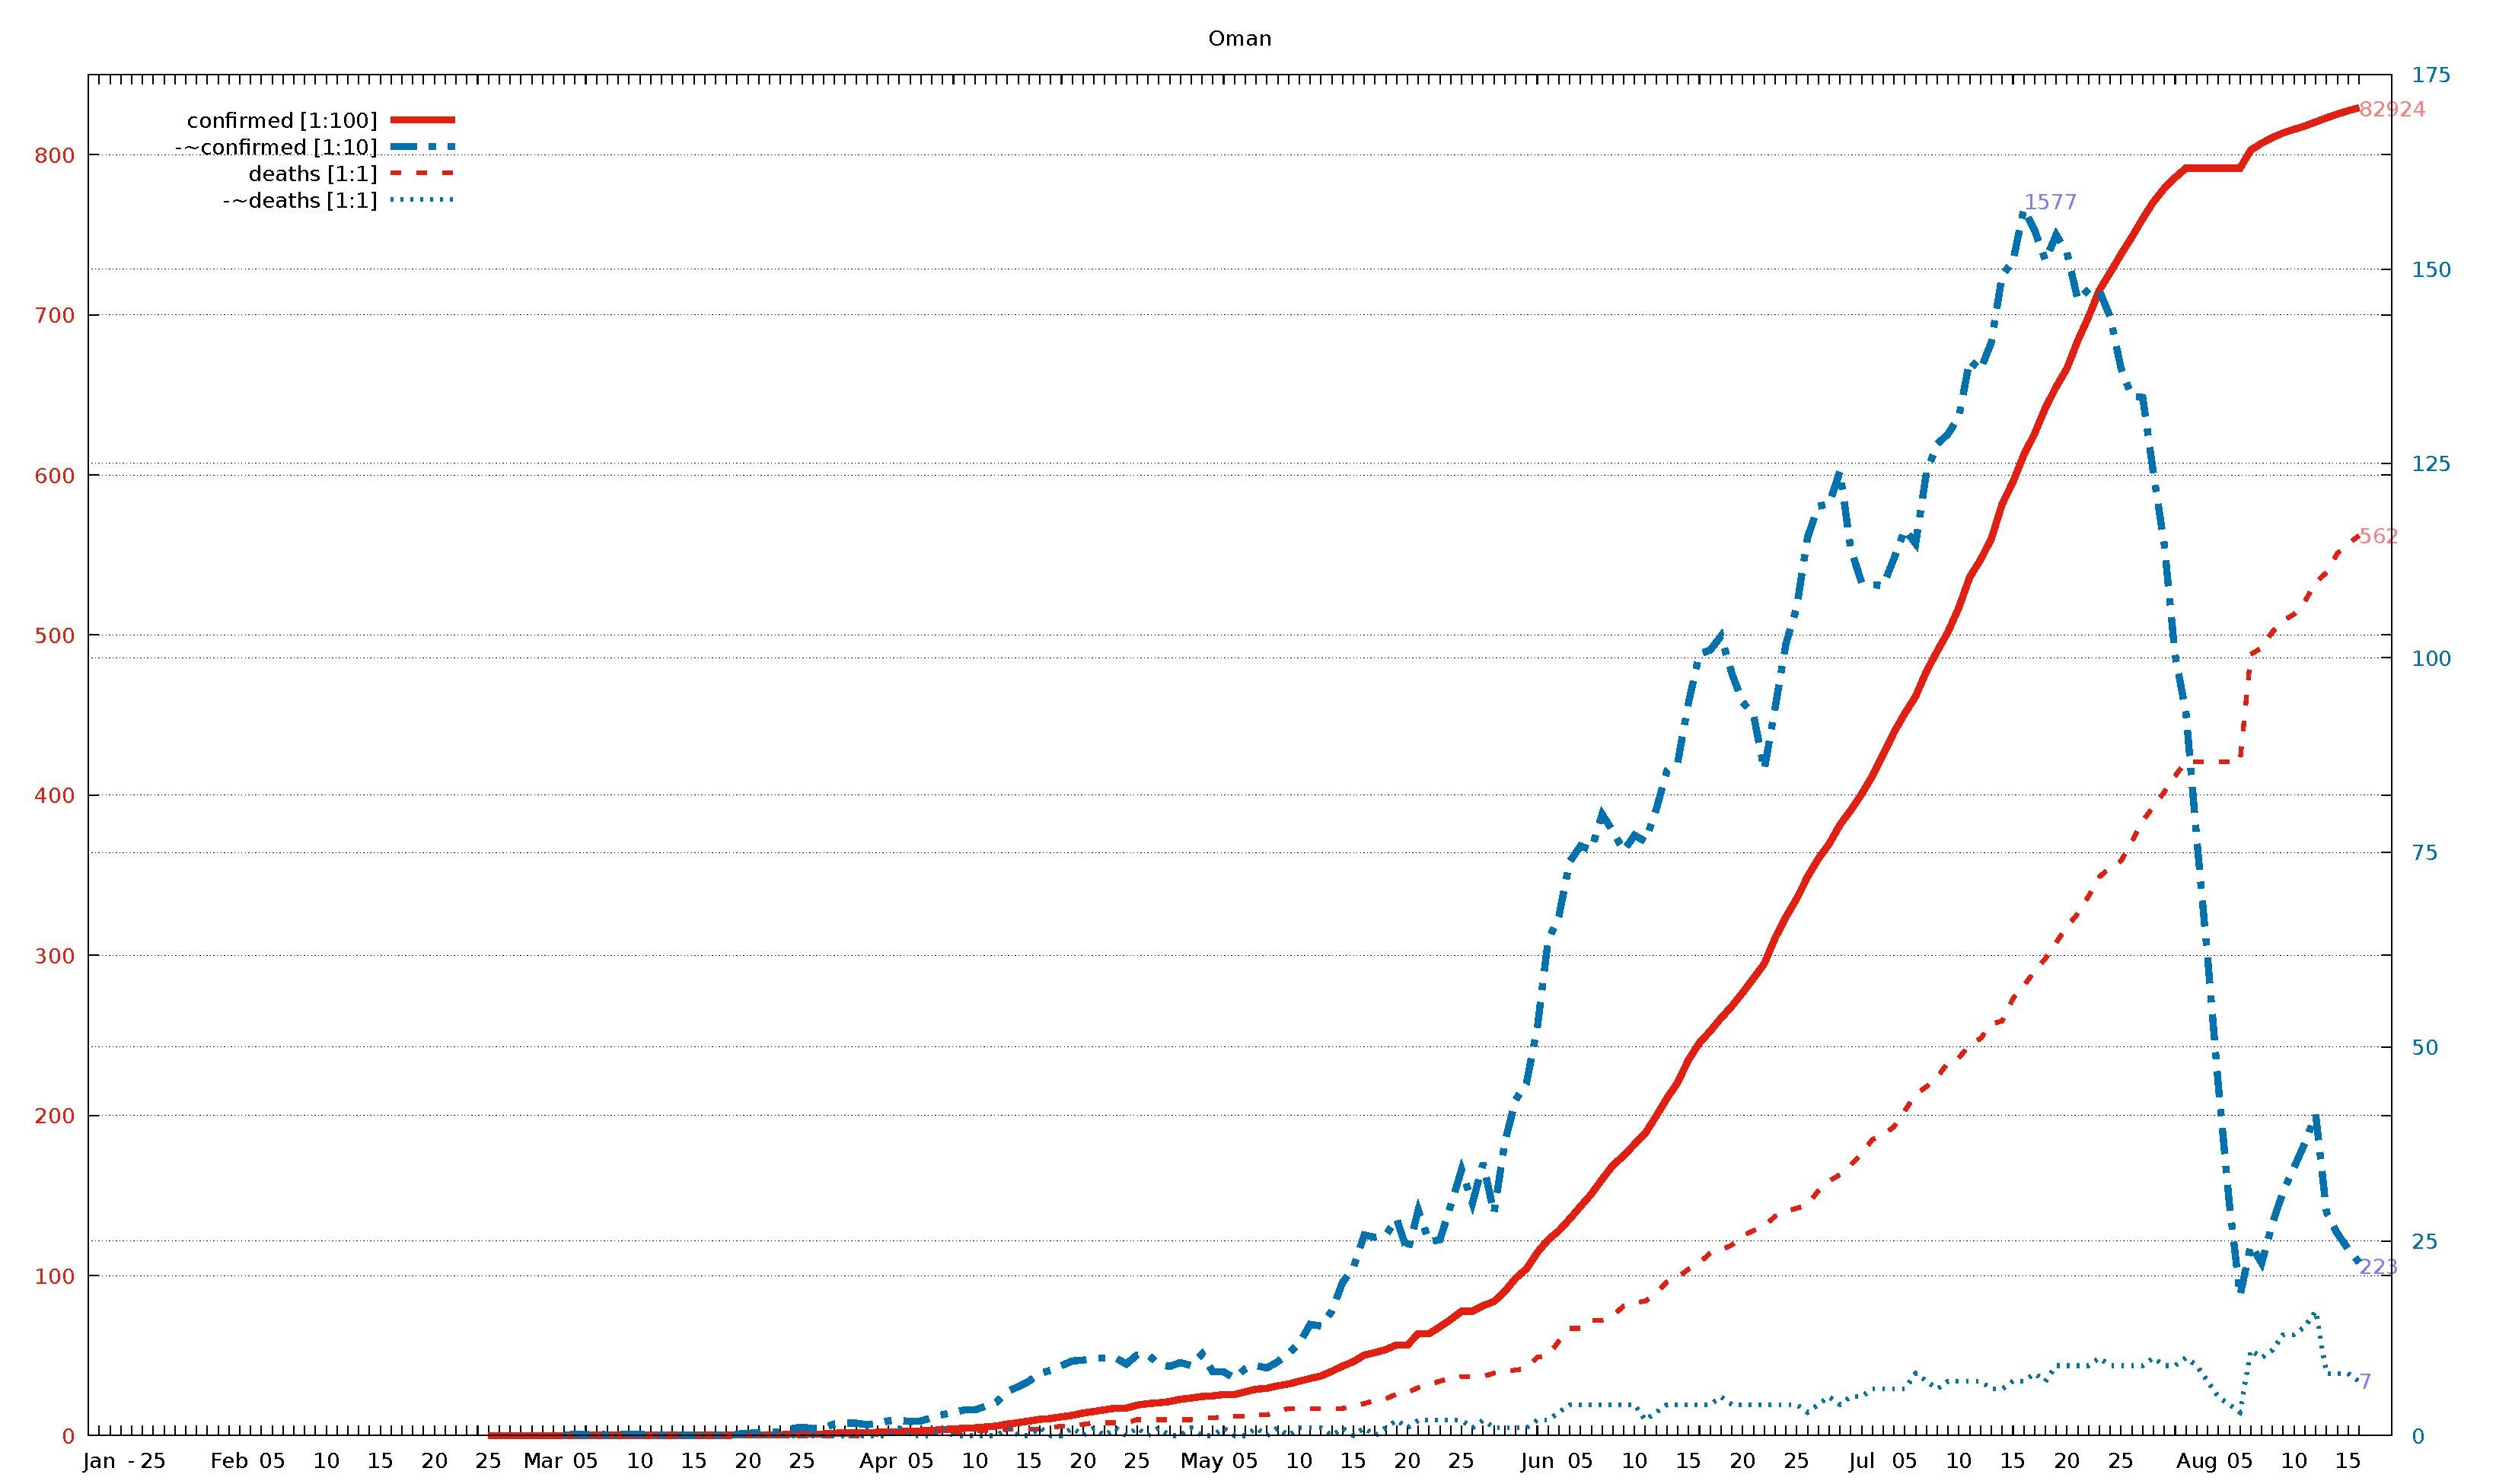
English: Diagram of WHO COVID-19 daily data (20 Jan - 16 Aug 2020) for "Total Confirmed Cases" (thick solid line), its smoothed increment (thick dash-dotted line), "Total Deaths" (thin dashed line) , and its smoothed increment (thin dotted line). Figures are taken from the available situation reports. Red and blue lines refer to the left and right vertical axis, respectively; the scaling factor for each curve is given in the legend. The horizontal axis starts on 20 Jan 2020 (situation report 1), and ends on 16 Aug 2020 (situation report 209). In the smoothed curves, for each day, 1/7 of the difference of the current day's figure and the figure a week ago is shown. For example, in situation report 115 (14 May 2020) and 121 (21 May 2020), there were 8676 and 5339 Total Confirmed Cases in Afghanistan, respectively, so the thick dash-dotted line passes through 477 = (8676-5339)/7 on 21 May.
For an overview of all related visualizations, and a more detailled description, see WHO Covid diagram set#Available country diagrams Jan-Aug 2020 (daily). |
| Date | |
| Source | Own work |
| Author | Jochen Burghardt |
Licensing[edit]
I, the copyright holder of this work, hereby publish it under the following license:
This file is licensed under the Creative Commons Attribution-Share Alike 4.0 International license.
- You are free:
- to share – to copy, distribute and transmit the work
- to remix – to adapt the work
- Under the following conditions:
- attribution – You must give appropriate credit, provide a link to the license, and indicate if changes were made. You may do so in any reasonable manner, but not in any way that suggests the licensor endorses you or your use.
- share alike – If you remix, transform, or build upon the material, you must distribute your contributions under the same or compatible license as the original.
Gnuplot source code[edit]
| Gnuplot source code |
|---|
set term pdf size 22,13
set term pdf font "sans,20"
set output "WHO_Covid_C_Oman.pdf"
set key autotitle columnhead
set termoption noenhanced
# (1) norm: 830 158 562 001
# (2) dist: 1,0:190 2,0:148 2,1:281
# (3,4) dist max: 281 2:562--1:158
# (4) right: 0 1 0 1
# (6,7) scMax: 850 175
# (8) scale: [1:100] [1:10] [1:1] [1:1]


set xrange [-1:212]
set yrange [0:850]
set y2range [0:175]
set xtics 3650,100
set ytics 100 textcolor "#e51e10"
set y2tics 25 textcolor "#0072b2"
set grid y y2

set title "Oman"

$data <<EOF
rep day "confirmed [1:100]" "-~confirmed [1:10]" "deaths [1:1]" "-~deaths [1:1]"
1	Jan	.	-	.	-
2	""	.	-	.	-
3	""	.	-	.	-
-	-	-	-	-	-
4	""	.	-	.	-
5	25	.	-	.	-
6	""	.	-	.	-
7	""	.	-	.	-
8	""	.	-	.	-
9	""	.	-	.	-
10	""	.	-	.	-
11	""	.	-	.	-
12	Feb	.	-	.	-
13	""	.	-	.	-
14	""	.	-	.	-
15	""	.	-	.	-
16	05	.	-	.	-
17	""	.	-	.	-
18	""	.	-	.	-
19	""	.	-	.	-
20	""	.	-	.	-
21	10	.	-	.	-
22	""	.	-	.	-
23	""	.	-	.	-
24	""	.	-	.	-
25	""	.	-	.	-
26	15	.	-	.	-
27	""	.	-	.	-
28	""	.	-	.	-
29	""	.	-	.	-
30	""	.	-	.	-
31	20	.	-	.	-
32	""	.	-	.	-
33	""	.	-	.	-
34	""	.	-	.	-
35	""	.	-	.	-
36	25	2	-	0	-
37	""	4	-	0	-
38	""	4	-	0	-
39	""	6	-	0	-
40	""	6	-	0	-
41	Mar	6	-	0	-
42	""	6	-	0	-
43	""	6	0	0	0
44	""	12	2	0	0
45	05	15	1	0	0
46	""	16	2	0	0
47	""	16	1	0	0
48	""	16	1	0	0
49	""	16	2	0	0
50	10	18	2	0	0
51	""	18	0	0	0
52	""	18	1	0	0
53	""	18	0	0	0
54	""	19	1	0	0
55	15	20	0	0	0
56	""	22	1	0	0
57	""	24	1	0	0
58	""	24	1	0	0
59	""	33	2	0	0
60	20	39	3	0	0
61	""	48	4	0	0
62	""	52	5	0	0
63	""	55	4	0	0
64	""	84	9	0	0
65	25	99	11	0	0
66	""	99	9	0	0
67	""	109	10	0	0
68	""	152	15	0	0
69	""	167	16	0	0
70	""	167	16	0	0
71	""	179	14	0	0
72	Apr	210	16	1	0
73	""	231	19	1	0
74	""	252	20	2	1
75	""	277	18	1	0
76	05	298	19	2	0
77	""	331	23	2	0
78	""	371	27	2	1
79	""	419	30	2	0
80	""	457	33	2	0
81	10	484	33	3	0
82	""	546	38	3	0
83	""	599	43	3	0
84	""	727	57	4	1
85	""	813	63	4	0
86	15	910	70	4	0
87	""	1019	80	4	1
88	""	1069	84	5	0
89	""	1180	90	6	0
90	""	1266	96	6	1
91	20	1410	97	7	0
92	""	1508	100	8	1
93	""	1614	100	8	0
94	""	1716	100	8	1
95	""	1716	92	8	0
96	25	1905	104	10	1
97	""	1998	104	10	0
98	""	2049	92	10	1
99	""	2131	89	10	0
100	""	2274	94	10	0
101	""	2348	90	10	1
102	May	2447	105	11	0
103	""	2483	82	11	0
104	""	2568	82	12	1
105	""	2568	74	12	0
106	05	2735	86	12	0
107	""	2903	90	13	1
108	""	2958	87	13	0
109	""	3112	95	15	1
110	""	3224	106	17	0
111	10	3400	119	17	1
112	""	3574	143	17	1
113	""	3721	141	17	1
114	""	4019	160	17	0
115	""	4341	197	17	1
116	15	4625	216	19	0
117	""	5029	258	20	1
118	""	5186	255	22	0
119	""	5379	258	23	1
120	""	5671	279	26	2
121	20	5671	236	27	1
122	""	6370	290	30	2
123	""	6370	249	32	2
124	""	6794	252	34	2
125	""	7257	296	36	2
126	25	7770	342	37	2
127	""	7770	299	37	1
128	""	8118	350	37	2
129	""	8373	286	39	1
130	""	9009	377	40	1
131	""	9820	432	41	1
132	""	10423	453	42	1
133	Jun	11437	524	49	2
134	""	12223	636	50	2
135	""	12799	668	59	3
136	""	13537	738	67	4
137	05	14316	758	67	4
138	""	15086	753	72	4
139	""	16016	799	72	4
140	""	16882	777	75	4
141	""	17486	752	81	4
142	10	18198	772	83	4
143	""	18887	764	84	2
144	""	19954	805	89	3
145	""	21071	855	96	4
146	""	22077	866	99	4
147	15	23481	943	104	4
148	""	24524	1005	108	4
149	""	25269	1010	114	4
150	""	26079	1028	116	5
151	""	26818	980	119	4
152	20	27670	943	125	4
153	""	28566	927	128	4
154	""	29471	856	131	4
155	""	31076	936	137	4
156	""	32394	1018	140	4
157	25	33536	1065	142	4
158	""	34902	1155	144	3
159	""	36034	1195	153	4
160	""	36953	1198	159	5
161	""	38150	1240	163	4
162	""	39060	1140	169	5
163	Jul	40070	1097	176	5
164	""	41194	1094	185	6
165	""	42555	1093	188	6
166	""	43929	1128	193	6
167	05	45106	1165	203	6
168	""	46178	1147	213	8
169	""	47735	1239	218	7
170	""	48997	1275	224	6
171	""	50207	1288	233	7
172	10	51725	1310	236	7
173	""	53614	1383	244	7
174	""	54697	1370	248	7
175	""	56015	1406	257	6
176	""	58179	1492	259	6
177	15	59568	1510	273	7
178	""	61247	1577	281	7
179	""	62574	1550	290	8
180	""	64193	1511	298	7
181	""	65504	1544	308	9
182	20	66661	1521	318	9
183	""	68400	1460	326	9
184	""	69887	1474	337	9
185	""	71547	1472	349	10
186	""	72646	1438	355	9
187	25	73791	1372	359	9
188	""	74858	1336	371	9
189	""	76005	1335	384	9
190	""	77058	1237	393	10
191	""	77904	1145	402	9
192	""	78569	1003	412	9
193	""	79159	930	421	10
194	Aug	79159	767	421	9
195	""	79159	615	421	7
196	""	79159	450	421	5
197	""	79159	300	421	4
198	05	79159	180	421	3
199	""	80286	245	488	11
200	""	80713	222	492	10
201	""	81067	273	502	11
202	""	81357	314	509	13
203	10	81580	345	513	13
204	""	81787	376	521	14
205	""	82050	413	533	16
206	""	82299	287	539	8
207	""	82531	260	551	8
208	15	82743	240	557	8
209	""	82924	223	562	7
EOF

# confirmed:
set label "82924  " at first 209,829           left back textcolor "#ff8080"
# -~confirmed:
set label "223    " at first 209, 22*850/175   left back textcolor "#8080ff"
set label "1577   " at first 178,157*850/175+9 left back textcolor "#8080ff"
# deaths:
set label "562    " at first 209,562           left back textcolor "#ff8080"
# -~deaths:
set label "7      " at first 209,  7*850/175   left back textcolor "#8080ff"

set multiplot
  plot $data using 0:($3/    100        ) with lines lc 7 lw 8 dt 1 title at 0.150, 0.920
replot $data using 0:($4/     10*850/175) with lines lc 6 lw 8 dt 4 title at 0.150, 0.902
replot $data using 0:($5/      1        ) with lines lc 7 lw 5 dt 2 title at 0.150, 0.884
replot $data using 0:($6/      1*850/175) with lines lc 6 lw 5 dt 3 title at 0.150, 0.866

# plot hor axis calendar
replot $data using 0:(0):xticlabel(2) with lines
|
File history
Click on a date/time to view the file as it appeared at that time.
| Date/Time | Thumbnail | Dimensions | User | Comment | |
|---|---|---|---|---|---|
| current | 19:28, 24 September 2020 |  | 3,300 × 1,950 (24 KB) | Jochen Burghardt (talk | contribs) | =={{int:filedesc}}== {{Information |description={{en|1=Diagram of WHO COVID-19 daily data (20 Jan - 16 Aug 2020) for ''"Total Confirmed Cases"'' (thick solid line), its smoothed increment (thick dash-dotted line), ''"Total Deaths"'' (thin dashed line), and its smoothed increment (thin dotted line); see File:WHO_Covid_2020_Jan-Aug_daily_C_Afghanistan.pdf for details.}} |date=2020-09-24 |source={{own}} |author=Jochen Burghardt |permission= |other_versions=[[:File:... |
You cannot overwrite this file.
File usage on Commons
There are no pages that use this file.