File:WHO Covid 2020 Jan-Aug daily C New Zealand.pdf
Jump to navigation
Jump to search

Size of this JPG preview of this PDF file: 800 × 473 pixels. Other resolutions: 320 × 189 pixels | 640 × 378 pixels | 1,024 × 605 pixels | 1,280 × 756 pixels | 3,300 × 1,950 pixels.
Original file (3,300 × 1,950 pixels, file size: 20 KB, MIME type: application/pdf)
Captions
Captions
Add a one-line explanation of what this file represents
Summary[edit]
| Description |
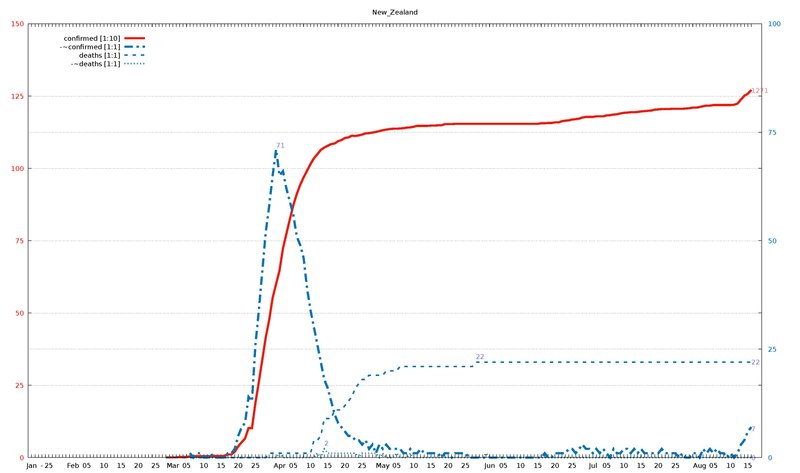
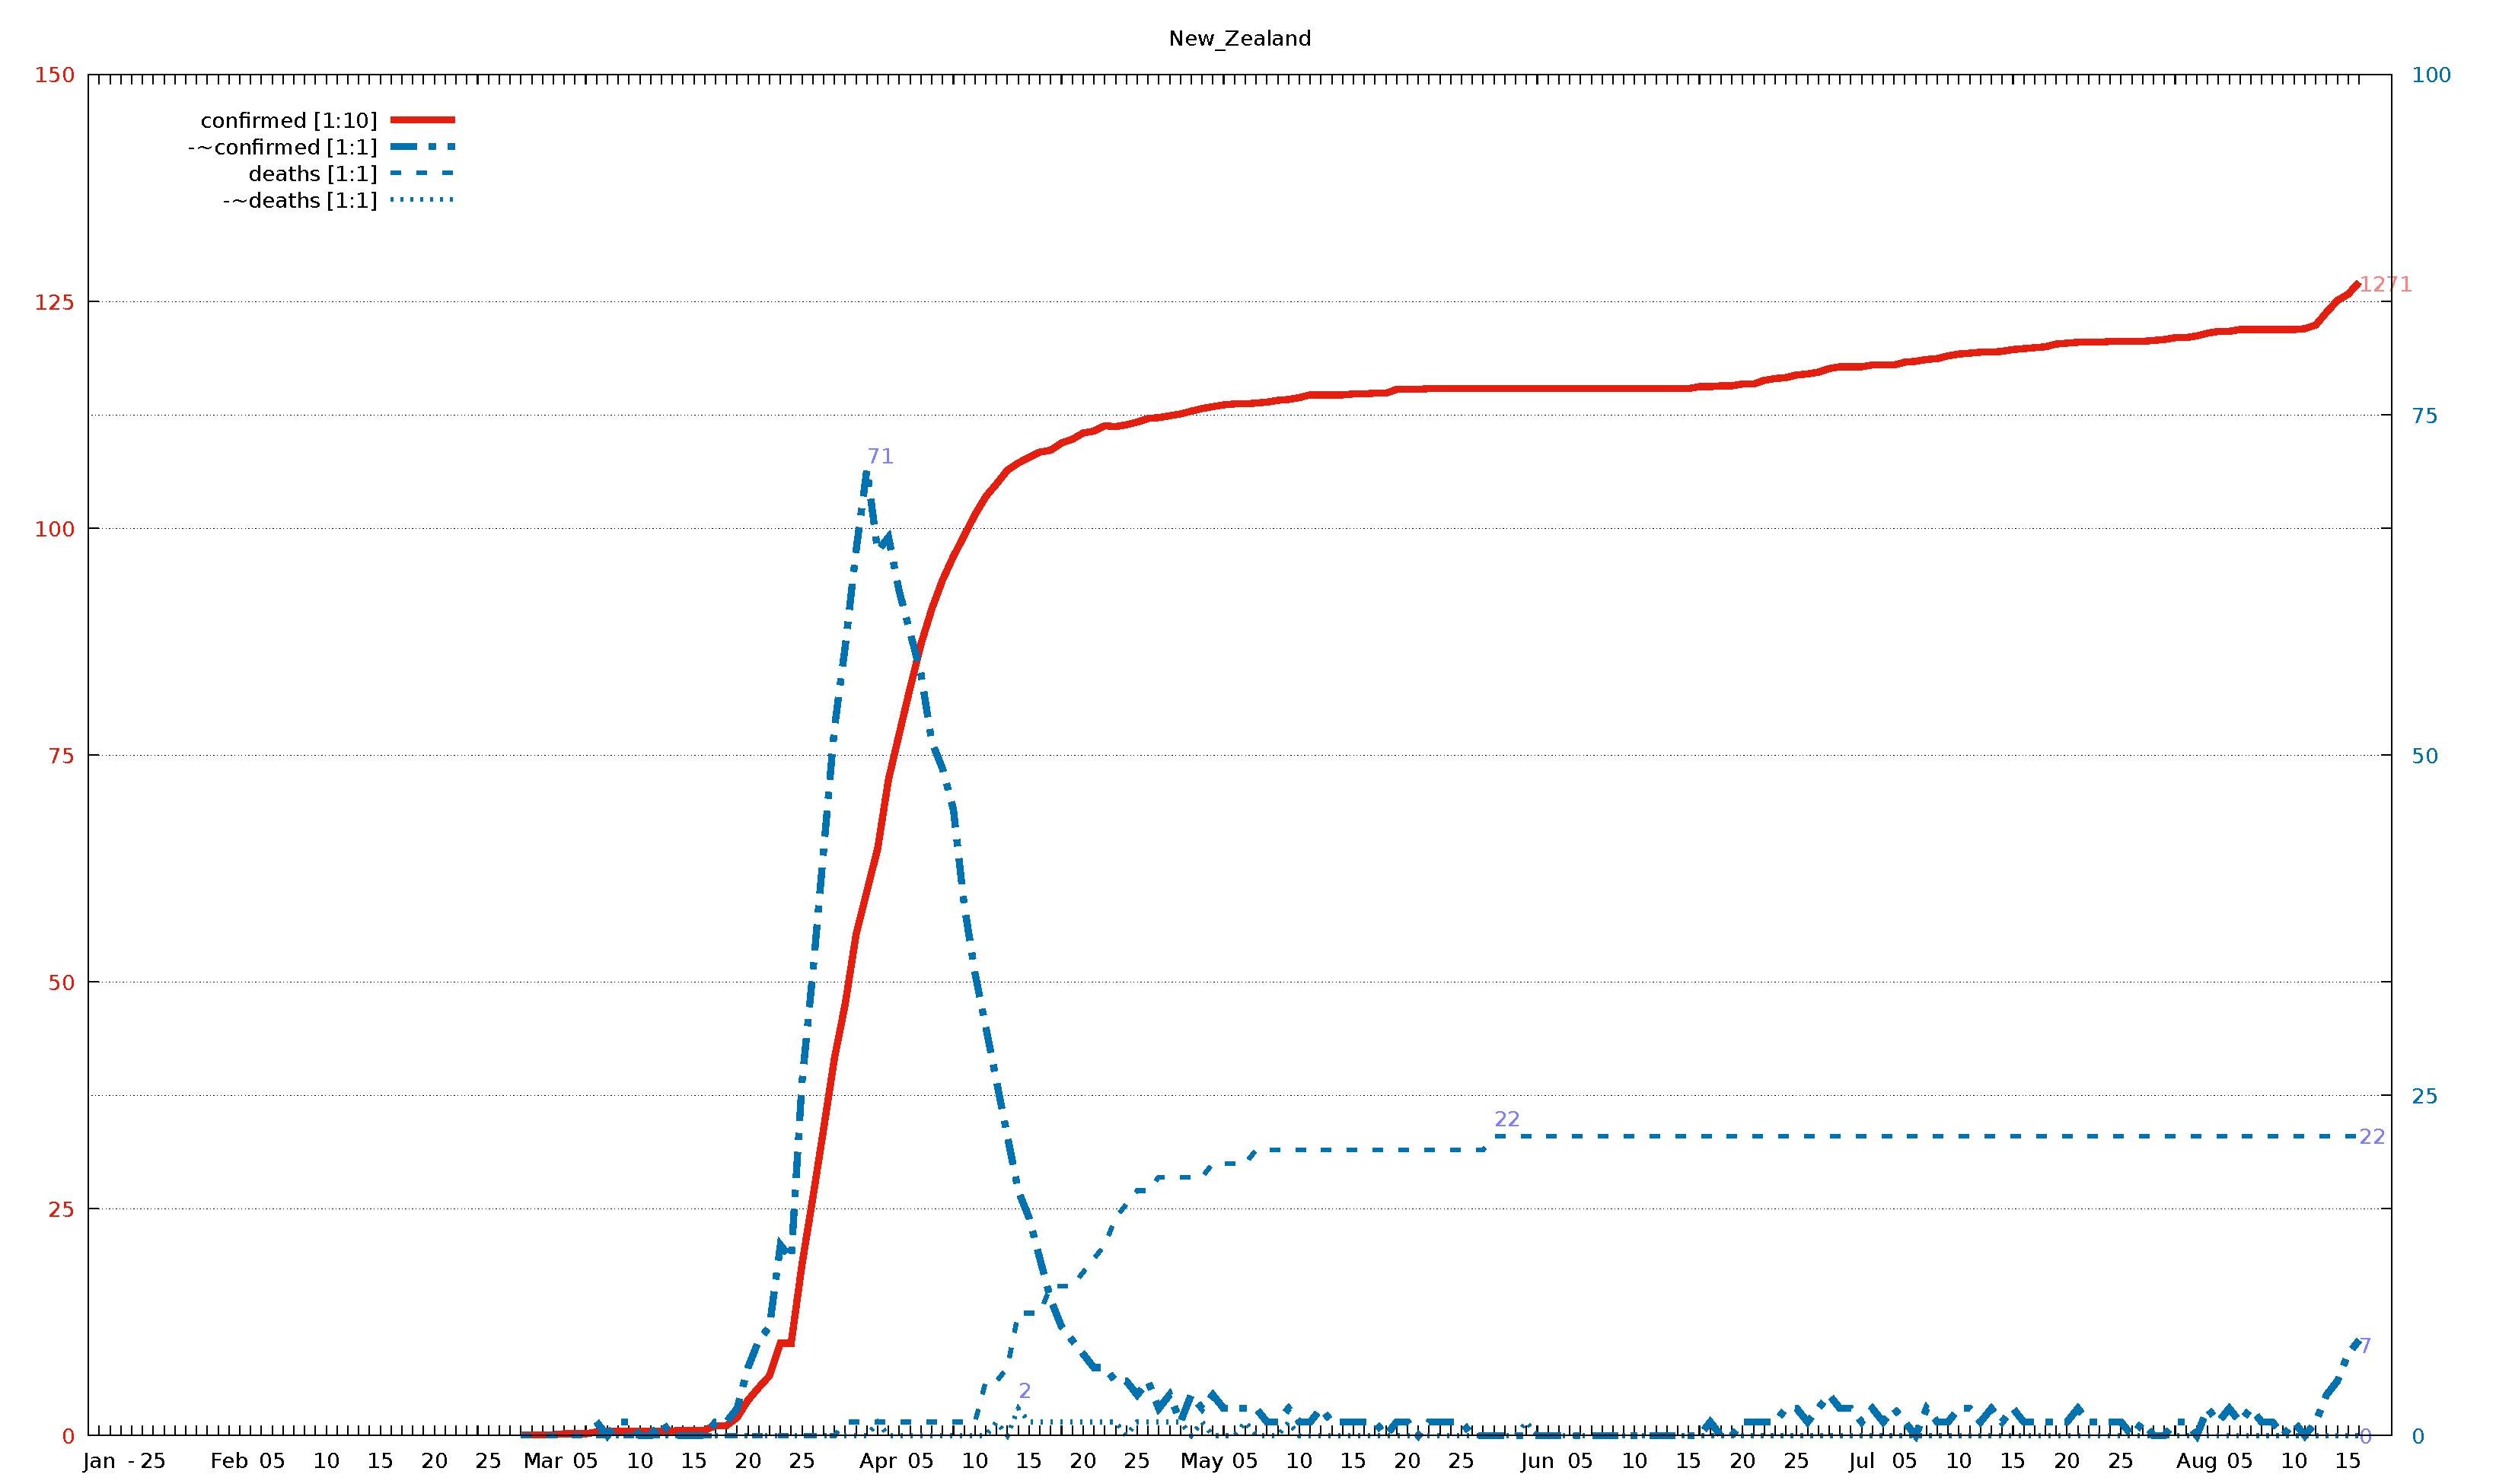
English: Diagram of WHO COVID-19 daily data (20 Jan - 16 Aug 2020) for "Total Confirmed Cases" (thick solid line), its smoothed increment (thick dash-dotted line), "Total Deaths" (thin dashed line) , and its smoothed increment (thin dotted line). Figures are taken from the available situation reports. Red and blue lines refer to the left and right vertical axis, respectively; the scaling factor for each curve is given in the legend. The horizontal axis starts on 20 Jan 2020 (situation report 1), and ends on 16 Aug 2020 (situation report 209). In the smoothed curves, for each day, 1/7 of the difference of the current day's figure and the figure a week ago is shown. For example, in situation report 115 (14 May 2020) and 121 (21 May 2020), there were 8676 and 5339 Total Confirmed Cases in Afghanistan, respectively, so the thick dash-dotted line passes through 477 = (8676-5339)/7 on 21 May.
For an overview of all related visualizations, and a more detailled description, see WHO Covid diagram set#Available country diagrams Jan-Aug 2020 (daily). |
| Date | |
| Source | Own work |
| Author | Jochen Burghardt |
Licensing[edit]
I, the copyright holder of this work, hereby publish it under the following license:
This file is licensed under the Creative Commons Attribution-Share Alike 4.0 International license.
- You are free:
- to share – to copy, distribute and transmit the work
- to remix – to adapt the work
- Under the following conditions:
- attribution – You must give appropriate credit, provide a link to the license, and indicate if changes were made. You may do so in any reasonable manner, but not in any way that suggests the licensor endorses you or your use.
- share alike – If you remix, transform, or build upon the material, you must distribute your contributions under the same or compatible license as the original.
Gnuplot source code[edit]
| Gnuplot source code |
|---|
set term pdf size 22,13
set term pdf font "sans,20"
set output "WHO_Covid_C_New_Zealand.pdf"
set key autotitle columnhead
set termoption noenhanced
# (1) norm: 128 001 001 001

set xrange [-1:212]
set yrange [0:150]
set y2range [0:100]
set xtics 3650,100
set ytics 25 textcolor "#e51e10"
set y2tics 25 textcolor "#0072b2"
set grid y y2

set title "New_Zealand"

$data <<EOF
rep day "confirmed [1:10]" "-~confirmed [1:1]" "deaths [1:1]" "-~deaths [1:1]"
1	Jan	.	-	.	-
2	""	.	-	.	-
3	""	.	-	.	-
-	-	-	-	-	-
4	""	.	-	.	-
5	25	.	-	.	-
6	""	.	-	.	-
7	""	.	-	.	-
8	""	.	-	.	-
9	""	.	-	.	-
10	""	.	-	.	-
11	""	.	-	.	-
12	Feb	.	-	.	-
13	""	.	-	.	-
14	""	.	-	.	-
15	""	.	-	.	-
16	05	.	-	.	-
17	""	.	-	.	-
18	""	.	-	.	-
19	""	.	-	.	-
20	""	.	-	.	-
21	10	.	-	.	-
22	""	.	-	.	-
23	""	.	-	.	-
24	""	.	-	.	-
25	""	.	-	.	-
26	15	.	-	.	-
27	""	.	-	.	-
28	""	.	-	.	-
29	""	.	-	.	-
30	""	.	-	.	-
31	20	.	-	.	-
32	""	.	-	.	-
33	""	.	-	.	-
34	""	.	-	.	-
35	""	.	-	.	-
36	25	.	-	.	-
37	""	.	-	.	-
38	""	.	-	.	-
39	""	1	-	0	-
40	""	1	-	0	-
41	Mar	1	-	0	-
42	""	1	-	0	-
43	""	2	-	0	-
44	""	2	-	0	-
45	05	2	-	0	-
46	""	4	1	0	0
47	""	5	0	0	0
48	""	5	1	0	0
49	""	5	1	0	0
50	10	5	0	0	0
51	""	5	0	0	0
52	""	5	1	0	0
53	""	5	0	0	0
54	""	6	0	0	0
55	15	6	0	0	0
56	""	6	0	0	0
57	""	11	1	0	0
58	""	11	1	0	0
59	""	20	2	0	0
60	20	39	5	0	0
61	""	53	7	0	0
62	""	66	8	0	0
63	""	102	14	0	0
64	""	102	13	0	0
65	25	189	26	0	0
66	""	262	34	0	0
67	""	338	43	0	0
68	""	416	52	0	0
69	""	476	58	1	0
70	""	552	65	1	0
71	""	600	71	1	0
72	Apr	647	65	1	1
73	""	723	66	1	0
74	""	774	62	1	0
75	""	824	59	1	0
76	05	872	56	1	0
77	""	911	51	1	0
78	""	943	49	1	0
79	""	969	46	1	0
80	""	992	39	1	0
81	10	1015	34	1	0
82	""	1035	30	4	0
83	""	1049	26	4	1
84	""	1064	22	5	0
85	""	1072	18	9	2
86	15	1078	16	9	1
87	""	1084	13	9	1
88	""	1086	10	11	1
89	""	1094	8	11	1
90	""	1098	7	11	1
91	20	1105	6	12	1
92	""	1107	5	13	1
93	""	1113	5	14	1
94	""	1112	4	16	1
95	""	1114	4	17	0
96	25	1117	3	18	1
97	""	1121	4	18	1
98	""	1122	2	19	1
99	""	1124	3	19	1
100	""	1126	1	19	1
101	""	1129	3	19	0
102	May	1132	2	19	1
103	""	1134	3	20	0
104	""	1136	2	20	0
105	""	1137	2	20	0
106	05	1137	2	20	1
107	""	1138	2	21	0
108	""	1139	1	21	0
109	""	1141	1	21	0
110	""	1142	2	21	1
111	10	1144	1	21	0
112	""	1147	1	21	0
113	""	1147	2	21	0
114	""	1147	1	21	0
115	""	1147	1	21	0
116	15	1148	1	21	0
117	""	1148	1	21	0
118	""	1149	1	21	0
119	""	1149	0	21	0
120	""	1153	1	21	0
121	20	1153	1	21	0
122	""	1153	0	21	0
123	""	1154	1	21	0
124	""	1154	1	21	0
125	""	1154	1	21	0
126	25	1154	1	21	0
127	""	1154	0	21	0
128	""	1154	0	21	0
129	""	1154	0	22	0
130	""	1154	0	22	0
131	""	1154	0	22	0
132	""	1154	0	22	1
133	Jun	1154	0	22	0
134	""	1154	0	22	0
135	""	1154	0	22	0
136	""	1154	0	22	0
137	05	1154	0	22	0
138	""	1154	0	22	0
139	""	1154	0	22	0
140	""	1154	0	22	0
141	""	1154	0	22	0
142	10	1154	0	22	0
143	""	1154	0	22	0
144	""	1154	0	22	0
145	""	1154	0	22	0
146	""	1154	0	22	0
147	15	1154	0	22	0
148	""	1156	0	22	0
149	""	1156	1	22	0
150	""	1157	0	22	0
151	""	1157	0	22	0
152	20	1159	1	22	0
153	""	1159	1	22	0
154	""	1163	1	22	0
155	""	1165	1	22	0
156	""	1166	2	22	0
157	25	1169	2	22	0
158	""	1170	1	22	0
159	""	1172	2	22	0
160	""	1176	3	22	0
161	""	1178	2	22	0
162	""	1178	2	22	0
163	Jul	1178	1	22	0
164	""	1180	2	22	0
165	""	1180	1	22	0
166	""	1180	2	22	0
167	05	1183	1	22	0
168	""	1184	0	22	0
169	""	1186	2	22	0
170	""	1187	1	22	0
171	""	1190	1	22	0
172	10	1192	2	22	0
173	""	1193	2	22	0
174	""	1194	1	22	0
175	""	1194	2	22	0
176	""	1195	1	22	0
177	15	1197	2	22	0
178	""	1198	1	22	0
179	""	1199	1	22	0
180	""	1200	1	22	0
181	""	1203	1	22	0
182	20	1204	1	22	0
183	""	1205	2	22	0
184	""	1205	1	22	0
185	""	1205	1	22	0
186	""	1206	1	22	0
187	25	1206	1	22	0
188	""	1206	0	22	0
189	""	1206	1	22	0
190	""	1207	0	22	0
191	""	1208	0	22	0
192	""	1210	1	22	0
193	""	1210	1	22	0
194	Aug	1212	0	22	0
195	""	1215	2	22	0
196	""	1217	1	22	0
197	""	1217	2	22	0
198	05	1219	1	22	0
199	""	1219	2	22	0
200	""	1219	1	22	0
201	""	1219	1	22	0
202	""	1219	0	22	0
203	10	1219	1	22	0
204	""	1220	0	22	0
205	""	1224	1	22	0
206	""	1238	3	22	0
207	""	1251	4	22	0
208	15	1258	6	22	0
209	""	1271	7	22	0
EOF

# confirmed:
set label "1271   " at first 209,127           left back textcolor "#ff8080"
# -~confirmed:
set label "7      " at first 209,  7*150/100   left back textcolor "#8080ff"
set label "71     " at first  71, 71*150/100+2 left back textcolor "#8080ff"
# deaths:
set label "22     " at first 209, 22*150/100   left back textcolor "#8080ff"
set label "22     " at first 129, 22*150/100+2 left back textcolor "#8080ff"
# -~deaths:
set label "0      " at first 209,  0*150/100   left back textcolor "#8080ff"
set label "2      " at first  85,  2*150/100+2 left back textcolor "#8080ff"

set multiplot
  plot $data using 0:($3/     10        ) with lines lc 7 lw 8 dt 1 title at 0.150, 0.920
replot $data using 0:($4/      1*150/100) with lines lc 6 lw 8 dt 4 title at 0.150, 0.902
replot $data using 0:($5/      1*150/100) with lines lc 6 lw 5 dt 2 title at 0.150, 0.884
replot $data using 0:($6/      1*150/100) with lines lc 6 lw 5 dt 3 title at 0.150, 0.866

# plot hor axis calendar
replot $data using 0:(0):xticlabel(2) with lines
|
File history
Click on a date/time to view the file as it appeared at that time.
| Date/Time | Thumbnail | Dimensions | User | Comment | |
|---|---|---|---|---|---|
| current | 19:27, 24 September 2020 |  | 3,300 × 1,950 (20 KB) | Jochen Burghardt (talk | contribs) | =={{int:filedesc}}== {{Information |description={{en|1=Diagram of WHO COVID-19 daily data (20 Jan - 16 Aug 2020) for ''"Total Confirmed Cases"'' (thick solid line), its smoothed increment (thick dash-dotted line), ''"Total Deaths"'' (thin dashed line), and its smoothed increment (thin dotted line); see File:WHO_Covid_2020_Jan-Aug_daily_C_Afghanistan.pdf for details.}} |date=2020-09-24 |source={{own}} |author=Jochen Burghardt |permission= |other_versions=[[:File:... |
You cannot overwrite this file.
File usage on Commons
There are no pages that use this file.