File:WHO Covid 2020 Jan-Aug daily C Netherlands.pdf
Jump to navigation
Jump to search

Size of this JPG preview of this PDF file: 800 × 473 pixels. Other resolutions: 320 × 189 pixels | 640 × 378 pixels | 1,024 × 605 pixels | 1,280 × 756 pixels | 3,300 × 1,950 pixels.
Original file (3,300 × 1,950 pixels, file size: 25 KB, MIME type: application/pdf)
Captions
Captions
Add a one-line explanation of what this file represents
Summary[edit]
| Description |
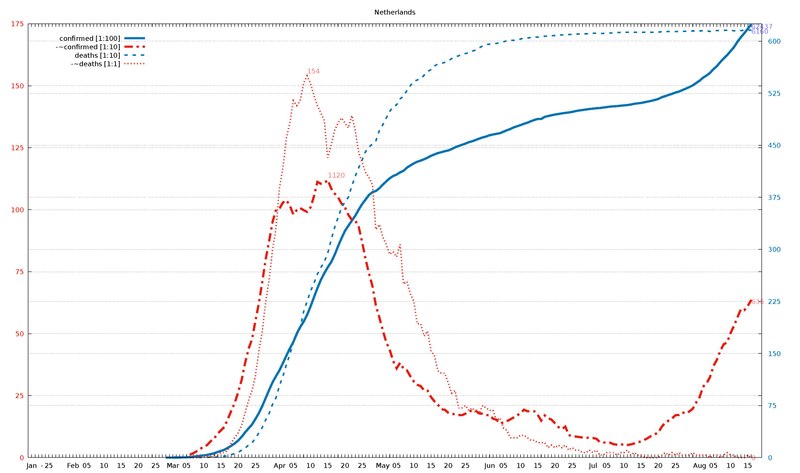
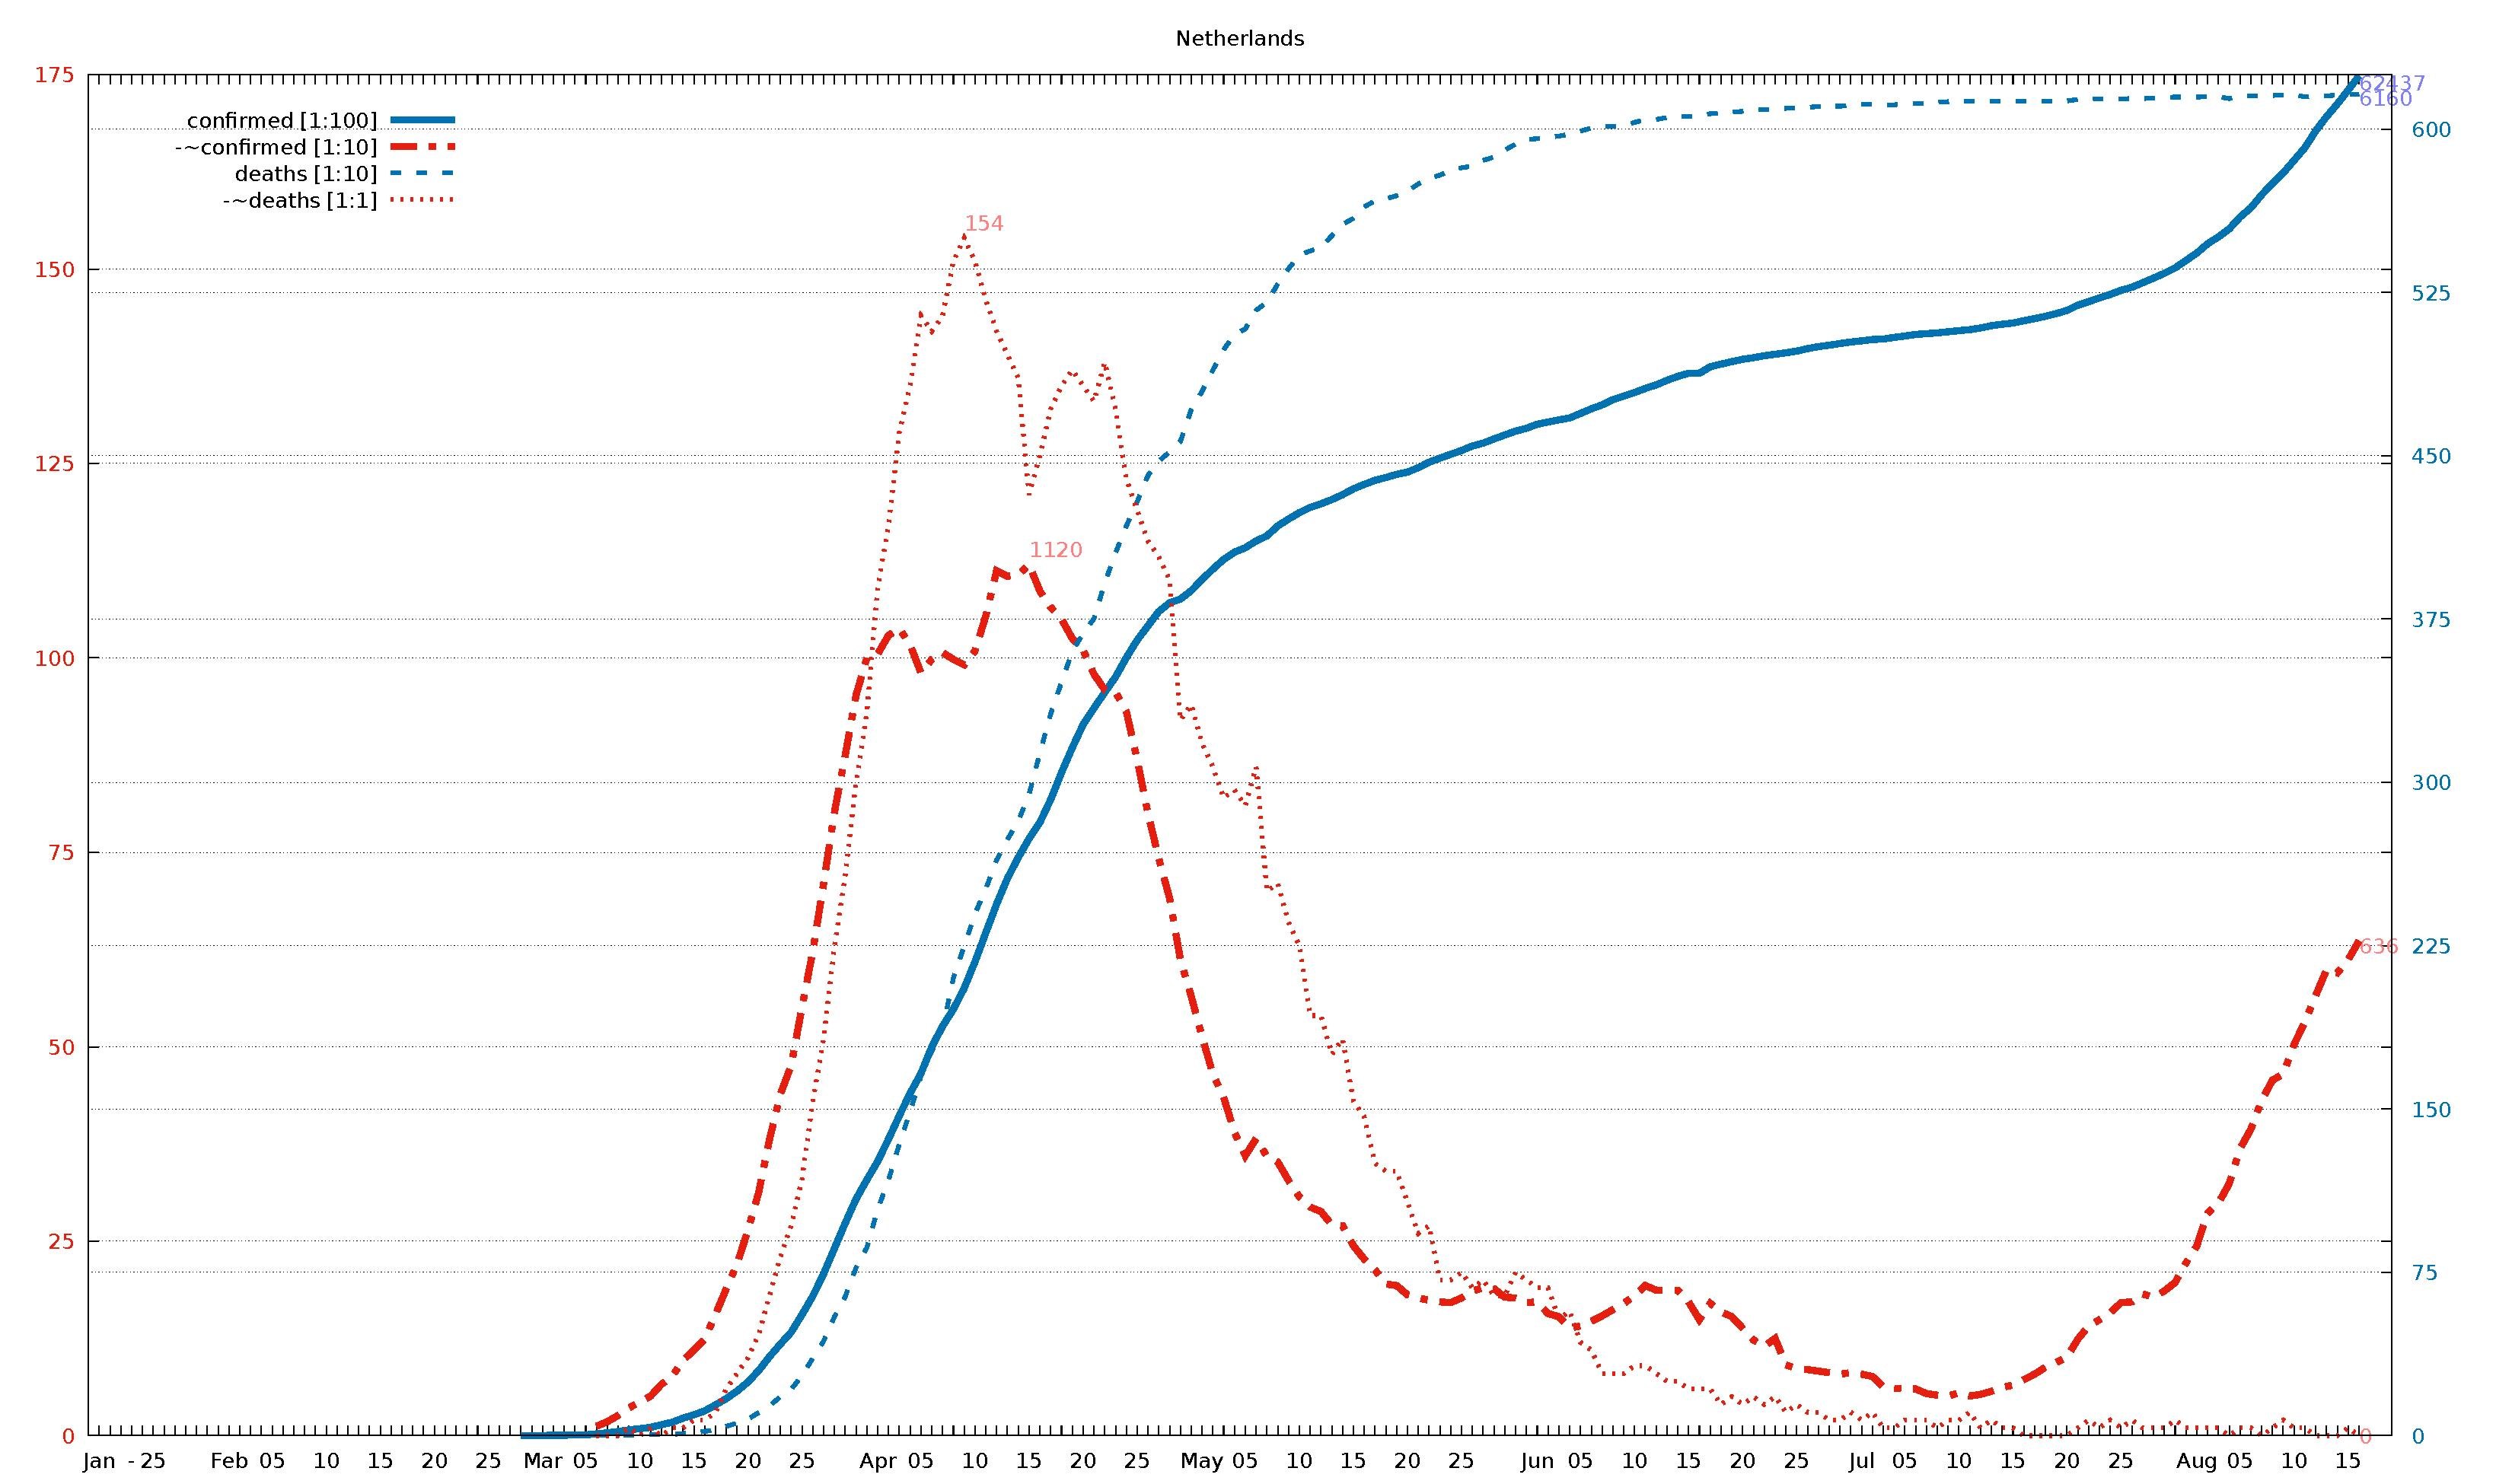
English: Diagram of WHO COVID-19 daily data (20 Jan - 16 Aug 2020) for "Total Confirmed Cases" (thick solid line), its smoothed increment (thick dash-dotted line), "Total Deaths" (thin dashed line) , and its smoothed increment (thin dotted line). Figures are taken from the available situation reports. Red and blue lines refer to the left and right vertical axis, respectively; the scaling factor for each curve is given in the legend. The horizontal axis starts on 20 Jan 2020 (situation report 1), and ends on 16 Aug 2020 (situation report 209). In the smoothed curves, for each day, 1/7 of the difference of the current day's figure and the figure a week ago is shown. For example, in situation report 115 (14 May 2020) and 121 (21 May 2020), there were 8676 and 5339 Total Confirmed Cases in Afghanistan, respectively, so the thick dash-dotted line passes through 477 = (8676-5339)/7 on 21 May.
For an overview of all related visualizations, and a more detailled description, see WHO Covid diagram set#Available country diagrams Jan-Aug 2020 (daily). |
| Date | |
| Source | Own work |
| Author | Jochen Burghardt |
Licensing[edit]
I, the copyright holder of this work, hereby publish it under the following license:
This file is licensed under the Creative Commons Attribution-Share Alike 4.0 International license.
- You are free:
- to share – to copy, distribute and transmit the work
- to remix – to adapt the work
- Under the following conditions:
- attribution – You must give appropriate credit, provide a link to the license, and indicate if changes were made. You may do so in any reasonable manner, but not in any way that suggests the licensor endorses you or your use.
- share alike – If you remix, transform, or build upon the material, you must distribute your contributions under the same or compatible license as the original.
Gnuplot source code[edit]
| Gnuplot source code |
|---|
set term pdf size 22,13
set term pdf font "sans,20"
set output "WHO_Covid_C_Netherlands.pdf"
set key autotitle columnhead
set termoption noenhanced
# (1) norm: 625 112 616 154
# (2) dist: 1,0:179 2,0:102 2,1:181 3,0:246 3,1:138 3,2:250
# (3,4) dist max: 250 3:154--2:616
# (4) right: 1 0 1 0
# (6,7) scMax: 175 625
# (8) scale: [1:100] [1:10] [1:10] [1:1]


set xrange [-1:212]
set yrange [0:175]
set y2range [0:625]
set xtics 3650,100
set ytics 25 textcolor "#e51e10"
set y2tics 75 textcolor "#0072b2"
set grid y y2

set title "Netherlands"

$data <<EOF
rep day "confirmed [1:100]" "-~confirmed [1:10]" "deaths [1:10]" "-~deaths [1:1]"
1	Jan	.	-	.	-
2	""	.	-	.	-
3	""	.	-	.	-
-	-	-	-	-	-
4	""	.	-	.	-
5	25	.	-	.	-
6	""	.	-	.	-
7	""	.	-	.	-
8	""	.	-	.	-
9	""	.	-	.	-
10	""	.	-	.	-
11	""	.	-	.	-
12	Feb	.	-	.	-
13	""	.	-	.	-
14	""	.	-	.	-
15	""	.	-	.	-
16	05	.	-	.	-
17	""	.	-	.	-
18	""	.	-	.	-
19	""	.	-	.	-
20	""	.	-	.	-
21	10	.	-	.	-
22	""	.	-	.	-
23	""	.	-	.	-
24	""	.	-	.	-
25	""	.	-	.	-
26	15	.	-	.	-
27	""	.	-	.	-
28	""	.	-	.	-
29	""	.	-	.	-
30	""	.	-	.	-
31	20	.	-	.	-
32	""	.	-	.	-
33	""	.	-	.	-
34	""	.	-	.	-
35	""	.	-	.	-
36	25	.	-	.	-
37	""	.	-	.	-
38	""	.	-	.	-
39	""	1	-	0	-
40	""	2	-	0	-
41	Mar	7	-	0	-
42	""	13	-	0	-
43	""	18	-	0	-
44	""	28	-	0	-
45	05	38	-	0	-
46	""	82	12	0	0
47	""	128	18	1	0
48	""	188	26	1	0
49	""	265	36	3	1
50	10	321	43	3	0
51	""	382	51	4	1
52	""	503	66	5	0
53	""	614	76	5	1
54	""	804	97	10	1
55	15	959	110	12	2
56	""	1135	124	20	2
57	""	1413	156	24	3
58	""	1705	189	43	6
59	""	2051	221	58	8
60	20	2460	264	76	10
61	""	2994	313	106	13
62	""	3631	381	136	18
63	""	4204	439	179	23
64	""	4749	476	213	27
65	25	5560	551	276	33
66	""	6412	623	356	43
67	""	7431	710	434	51
68	""	8603	802	546	63
69	""	9762	875	639	72
70	""	10866	952	771	84
71	""	11750	1000	864	93
72	Apr	12595	1005	1039	109
73	""	13614	1029	1173	117
74	""	14697	1038	1339	129
75	""	15723	1017	1487	135
76	05	16627	981	1651	144
77	""	17851	998	1766	142
78	""	18803	1007	1867	144
79	""	19580	998	2101	151
80	""	20549	991	2248	154
81	10	21762	1009	2396	151
82	""	23097	1054	2511	146
83	""	24413	1112	2643	142
84	""	25587	1105	2737	139
85	""	26551	1107	2823	136
86	15	27419	1120	2945	121
87	""	28153	1086	3134	126
88	""	29214	1065	3315	132
89	""	30449	1050	3459	135
90	""	31589	1025	3601	137
91	20	32655	1010	3684	135
92	""	33405	979	3751	133
93	""	34134	959	3916	138
94	""	34842	956	4054	132
95	""	35729	931	4177	123
96	25	36535	869	4289	119
97	""	37190	800	4409	115
98	""	37845	742	4475	113
99	""	38245	691	4518	110
100	""	38416	612	4566	92
101	""	38802	565	4711	94
102	May	39316	513	4795	89
103	""	39791	465	4893	86
104	""	40236	435	4987	82
105	""	40571	390	5056	83
106	05	40770	360	5082	81
107	""	41087	382	5168	86
108	""	41319	359	5204	70
109	""	41774	352	5288	71
110	""	42093	328	5359	66
111	10	42382	307	5422	63
112	""	42627	294	5440	54
113	""	42788	288	5456	54
114	""	42984	271	5510	49
115	""	43211	270	5562	51
116	15	43481	244	5590	43
117	""	43681	227	5643	41
118	""	43870	213	5670	35
119	""	43995	195	5680	34
120	""	44141	193	5694	34
121	20	44249	181	5715	30
122	""	44447	177	5748	26
123	""	44700	174	5775	27
124	""	44888	172	5788	20
125	""	45064	171	5811	20
126	25	45236	177	5822	21
127	""	45445	186	5830	19
128	""	45578	190	5856	20
129	""	45768	189	5871	18
130	""	45950	178	5903	18
131	""	46126	177	5931	21
132	""	46257	171	5951	20
133	Jun	46442	172	5956	19
134	""	46545	157	5962	19
135	""	46647	153	5967	15
136	""	46733	138	5977	16
137	05	46942	141	5990	12
138	""	47152	147	6005	11
139	""	47335	154	6011	8
140	""	47574	162	6013	8
141	""	47739	170	6016	8
142	10	47903	180	6031	9
143	""	48087	193	6042	9
144	""	48251	187	6044	8
145	""	48461	187	6053	7
146	""	48640	187	6057	7
147	15	48783	172	6059	6
148	""	48783	149	6059	6
149	""	49087	170	6070	6
150	""	49204	159	6074	4
151	""	49319	153	6078	5
152	20	49426	138	6081	4
153	""	49502	123	6089	5
154	""	49593	115	6090	4
155	""	49658	125	6090	5
156	""	49722	91	6095	3
157	25	49804	86	6097	4
158	""	49914	85	6100	3
159	""	50005	83	6103	3
160	""	50074	81	6105	2
161	""	50147	79	6105	2
162	""	50223	81	6107	3
163	Jul	50273	79	6113	2
164	""	50335	76	6115	3
165	""	50357	63	6109	1
166	""	50432	61	6111	1
167	05	50493	60	6117	2
168	""	50566	60	6118	2
169	""	50602	54	6119	2
170	""	50639	52	6123	1
171	""	50691	51	6126	2
172	10	50743	55	6128	2
173	""	50785	51	6127	3
174	""	50866	53	6128	1
175	""	50967	57	6128	2
176	""	51038	62	6128	1
177	15	51091	65	6128	1
178	""	51197	72	6127	0
179	""	51296	79	6128	0
180	""	51399	88	6129	0
181	""	51526	94	6129	0
182	20	51670	101	6129	0
183	""	51910	124	6136	1
184	""	52073	141	6136	2
185	""	52241	149	6139	1
186	""	52404	158	6139	2
187	25	52595	171	6139	1
188	""	52732	172	6140	2
189	""	52946	182	6140	1
190	""	53151	178	6141	1
191	""	53374	186	6145	1
192	""	53621	197	6147	2
193	""	53963	222	6147	1
194	Aug	54301	244	6147	1
195	""	54732	286	6148	1
196	""	55043	299	6148	1
197	""	55415	324	6140	0
198	05	55955	369	6150	1
199	""	56381	394	6153	1
200	""	56982	431	6153	0
201	""	57501	457	6154	1
202	""	57987	465	6157	2
203	10	58564	503	6157	1
204	""	59139	532	6148	1
205	""	59918	566	6150	0
206	""	60572	599	6152	0
207	""	61149	595	6156	0
208	15	61785	612	6158	1
209	""	62437	636	6160	0
EOF

# confirmed:
set label "62437  " at first 209,624*175/625   left back textcolor "#8080ff"
# -~confirmed:
set label "636    " at first 209, 63           left back textcolor "#ff8080"
set label "1120   " at first  86,112        +2 left back textcolor "#ff8080"
# deaths:
set label "6160   " at first 209,616*175/625   left back textcolor "#8080ff"
# -~deaths:
set label "0      " at first 209,  0           left back textcolor "#ff8080"
set label "154    " at first  80,154        +2 left back textcolor "#ff8080"

set multiplot
  plot $data using 0:($3/    100*175/625) with lines lc 6 lw 8 dt 1 title at 0.150, 0.920
replot $data using 0:($4/     10        ) with lines lc 7 lw 8 dt 4 title at 0.150, 0.902
replot $data using 0:($5/     10*175/625) with lines lc 6 lw 5 dt 2 title at 0.150, 0.884
replot $data using 0:($6/      1        ) with lines lc 7 lw 5 dt 3 title at 0.150, 0.866

# plot hor axis calendar
replot $data using 0:(0):xticlabel(2) with lines
|
File history
Click on a date/time to view the file as it appeared at that time.
| Date/Time | Thumbnail | Dimensions | User | Comment | |
|---|---|---|---|---|---|
| current | 19:26, 24 September 2020 |  | 3,300 × 1,950 (25 KB) | Jochen Burghardt (talk | contribs) | =={{int:filedesc}}== {{Information |description={{en|1=Diagram of WHO COVID-19 daily data (20 Jan - 16 Aug 2020) for ''"Total Confirmed Cases"'' (thick solid line), its smoothed increment (thick dash-dotted line), ''"Total Deaths"'' (thin dashed line), and its smoothed increment (thin dotted line); see File:WHO_Covid_2020_Jan-Aug_daily_C_Afghanistan.pdf for details.}} |date=2020-09-24 |source={{own}} |author=Jochen Burghardt |permission= |other_versions=[[:File:... |
You cannot overwrite this file.
File usage on Commons
There are no pages that use this file.