File:WHO Covid 2020 Jan-Aug daily C Latvia.pdf
Jump to navigation
Jump to search

Size of this JPG preview of this PDF file: 800 × 473 pixels. Other resolutions: 320 × 189 pixels | 640 × 378 pixels | 1,024 × 605 pixels | 1,280 × 756 pixels | 3,300 × 1,950 pixels.
Original file (3,300 × 1,950 pixels, file size: 21 KB, MIME type: application/pdf)
Captions
Captions
Add a one-line explanation of what this file represents
Summary[edit]
| Description |
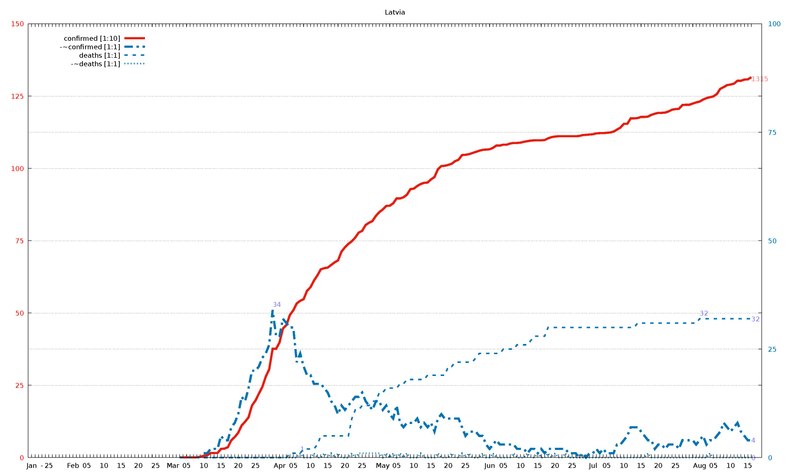
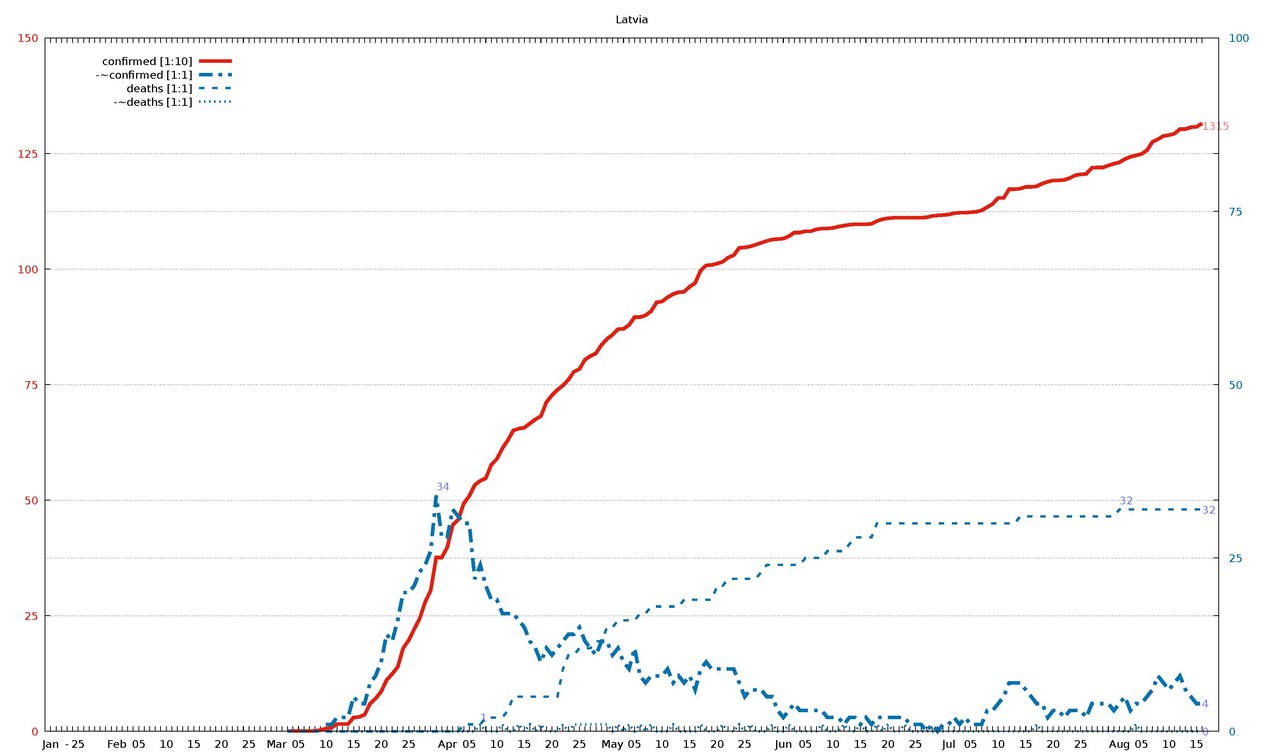
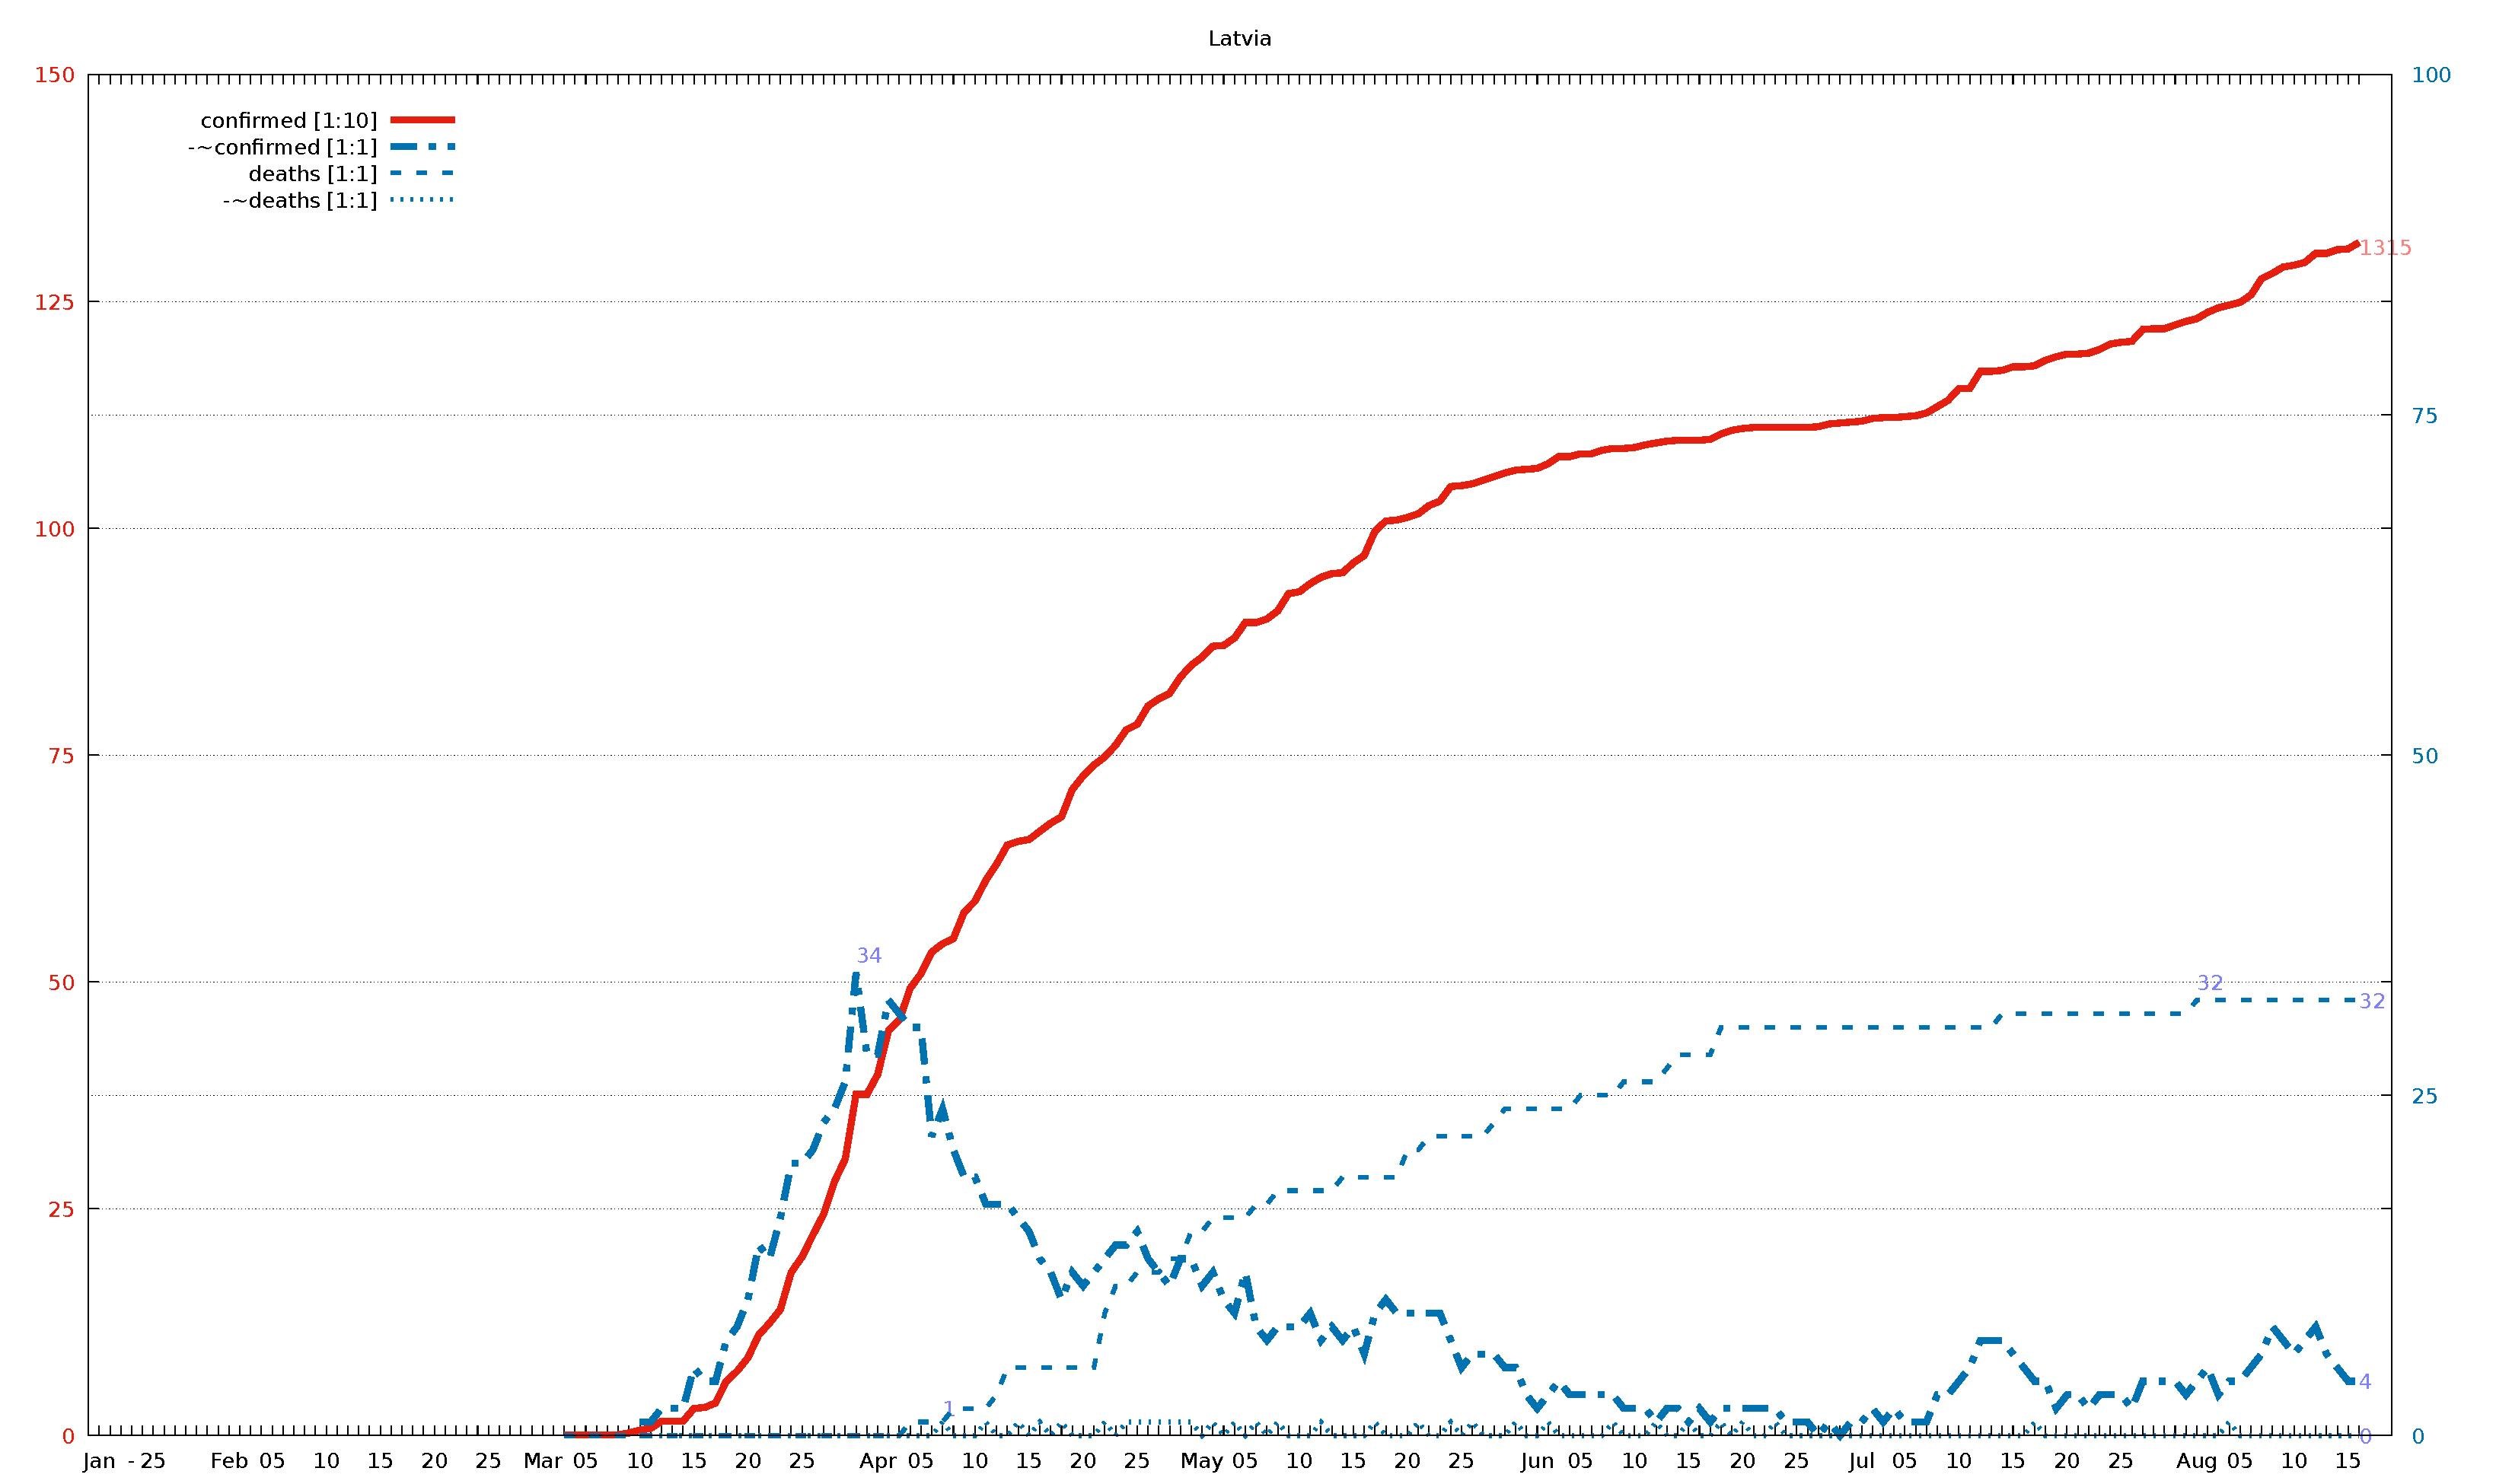
English: Diagram of WHO COVID-19 daily data (20 Jan - 16 Aug 2020) for "Total Confirmed Cases" (thick solid line), its smoothed increment (thick dash-dotted line), "Total Deaths" (thin dashed line) , and its smoothed increment (thin dotted line). Figures are taken from the available situation reports. Red and blue lines refer to the left and right vertical axis, respectively; the scaling factor for each curve is given in the legend. The horizontal axis starts on 20 Jan 2020 (situation report 1), and ends on 16 Aug 2020 (situation report 209). In the smoothed curves, for each day, 1/7 of the difference of the current day's figure and the figure a week ago is shown. For example, in situation report 115 (14 May 2020) and 121 (21 May 2020), there were 8676 and 5339 Total Confirmed Cases in Afghanistan, respectively, so the thick dash-dotted line passes through 477 = (8676-5339)/7 on 21 May.
For an overview of all related visualizations, and a more detailled description, see WHO Covid diagram set#Available country diagrams Jan-Aug 2020 (daily). |
| Date | |
| Source | Own work |
| Author | Jochen Burghardt |
Licensing[edit]
I, the copyright holder of this work, hereby publish it under the following license:
This file is licensed under the Creative Commons Attribution-Share Alike 4.0 International license.
- You are free:
- to share – to copy, distribute and transmit the work
- to remix – to adapt the work
- Under the following conditions:
- attribution – You must give appropriate credit, provide a link to the license, and indicate if changes were made. You may do so in any reasonable manner, but not in any way that suggests the licensor endorses you or your use.
- share alike – If you remix, transform, or build upon the material, you must distribute your contributions under the same or compatible license as the original.
Gnuplot source code[edit]
| Gnuplot source code |
|---|
set term pdf size 22,13
set term pdf font "sans,20"
set output "WHO_Covid_C_Latvia.pdf"
set key autotitle columnhead
set termoption noenhanced
# (1) norm: 132 001 001 001

set xrange [-1:212]
set yrange [0:150]
set y2range [0:100]
set xtics 3650,100
set ytics 25 textcolor "#e51e10"
set y2tics 25 textcolor "#0072b2"
set grid y y2

set title "Latvia"

$data <<EOF
rep day "confirmed [1:10]" "-~confirmed [1:1]" "deaths [1:1]" "-~deaths [1:1]"
1	Jan	.	-	.	-
2	""	.	-	.	-
3	""	.	-	.	-
-	-	-	-	-	-
4	""	.	-	.	-
5	25	.	-	.	-
6	""	.	-	.	-
7	""	.	-	.	-
8	""	.	-	.	-
9	""	.	-	.	-
10	""	.	-	.	-
11	""	.	-	.	-
12	Feb	.	-	.	-
13	""	.	-	.	-
14	""	.	-	.	-
15	""	.	-	.	-
16	05	.	-	.	-
17	""	.	-	.	-
18	""	.	-	.	-
19	""	.	-	.	-
20	""	.	-	.	-
21	10	.	-	.	-
22	""	.	-	.	-
23	""	.	-	.	-
24	""	.	-	.	-
25	""	.	-	.	-
26	15	.	-	.	-
27	""	.	-	.	-
28	""	.	-	.	-
29	""	.	-	.	-
30	""	.	-	.	-
31	20	.	-	.	-
32	""	.	-	.	-
33	""	.	-	.	-
34	""	.	-	.	-
35	""	.	-	.	-
36	25	.	-	.	-
37	""	.	-	.	-
38	""	.	-	.	-
39	""	.	-	.	-
40	""	.	-	.	-
41	Mar	.	-	.	-
42	""	.	-	.	-
43	""	1	-	0	-
44	""	1	-	0	-
45	05	1	-	0	-
46	""	1	-	0	-
47	""	1	-	0	-
48	""	1	-	0	-
49	""	3	-	0	-
50	10	6	1	0	0
51	""	8	1	0	0
52	""	16	2	0	0
53	""	16	2	0	0
54	""	16	2	0	0
55	15	30	5	0	0
56	""	31	4	0	0
57	""	36	4	0	0
58	""	60	7	0	0
59	""	71	8	0	0
60	20	86	10	0	0
61	""	111	14	0	0
62	""	124	13	0	0
63	""	139	16	0	0
64	""	180	20	0	0
65	25	197	20	0	0
66	""	221	21	0	0
67	""	244	23	0	0
68	""	280	24	0	0
69	""	305	26	0	0
70	""	376	34	0	0
71	""	376	28	0	0
72	Apr	398	28	0	0
73	""	446	32	0	0
74	""	458	31	0	0
75	""	493	30	1	0
76	05	509	30	1	0
77	""	533	22	1	0
78	""	542	24	1	1
79	""	548	21	2	0
80	""	577	19	2	0
81	10	589	19	2	0
82	""	612	17	2	1
83	""	630	17	3	0
84	""	651	17	5	0
85	""	655	16	5	1
86	15	657	15	5	0
87	""	666	13	5	1
88	""	675	12	5	0
89	""	682	10	5	1
90	""	712	12	5	0
91	20	727	11	5	0
92	""	739	12	5	0
93	""	748	13	9	1
94	""	761	14	11	0
95	""	778	14	11	1
96	25	784	15	12	1
97	""	804	13	12	1
98	""	812	12	12	1
99	""	818	11	13	1
100	""	836	13	13	1
101	""	849	13	15	1
102	May	858	11	15	0
103	""	870	12	16	1
104	""	871	10	16	0
105	""	879	9	16	1
106	05	896	12	16	0
107	""	896	8	17	1
108	""	900	7	17	0
109	""	909	8	18	1
110	""	928	8	18	0
111	10	930	8	18	0
112	""	939	9	18	0
113	""	946	7	18	1
114	""	950	8	18	0
115	""	951	7	19	0
116	15	962	8	19	0
117	""	970	6	19	0
118	""	997	9	19	1
119	""	1008	10	19	0
120	""	1009	9	19	0
121	20	1012	9	21	0
122	""	1016	9	21	1
123	""	1025	9	22	0
124	""	1030	9	22	0
125	""	1046	7	22	1
126	25	1047	5	22	0
127	""	1049	6	22	1
128	""	1053	6	22	0
129	""	1057	6	23	0
130	""	1061	5	24	0
131	""	1064	5	24	1
132	""	1065	3	24	0
133	Jun	1066	2	24	0
134	""	1071	3	24	1
135	""	1079	4	24	0
136	""	1079	3	24	0
137	05	1082	3	25	0
138	""	1082	3	25	0
139	""	1086	3	25	0
140	""	1088	3	25	1
141	""	1088	2	26	0
142	10	1089	2	26	0
143	""	1092	2	26	0
144	""	1094	1	26	1
145	""	1096	2	27	0
146	""	1097	2	28	0
147	15	1097	1	28	1
148	""	1097	2	28	0
149	""	1098	1	28	0
150	""	1104	2	30	1
151	""	1108	2	30	0
152	20	1110	2	30	1
153	""	1111	2	30	0
154	""	1111	2	30	0
155	""	1111	2	30	1
156	""	1111	1	30	0
157	25	1111	1	30	0
158	""	1111	1	30	0
159	""	1112	0	30	0
160	""	1115	1	30	0
161	""	1116	0	30	0
162	""	1117	1	30	0
163	Jul	1118	1	30	0
164	""	1121	2	30	0
165	""	1122	1	30	0
166	""	1122	2	30	0
167	05	1123	1	30	0
168	""	1124	1	30	0
169	""	1127	1	30	0
170	""	1134	3	30	0
171	""	1141	3	30	0
172	10	1154	4	30	0
173	""	1154	5	30	0
174	""	1173	7	30	0
175	""	1173	7	30	0
176	""	1174	7	31	0
177	15	1178	6	31	0
178	""	1178	5	31	0
179	""	1179	4	31	1
180	""	1185	4	31	0
181	""	1189	2	31	0
182	20	1192	3	31	0
183	""	1192	3	31	0
184	""	1193	2	31	0
185	""	1197	3	31	0
186	""	1203	3	31	0
187	25	1205	3	31	0
188	""	1206	2	31	0
189	""	1219	4	31	0
190	""	1220	4	31	0
191	""	1220	4	31	0
192	""	1224	4	31	0
193	""	1228	3	31	0
194	Aug	1231	4	32	0
195	""	1238	5	32	0
196	""	1243	3	32	0
197	""	1246	4	32	1
198	05	1249	4	32	0
199	""	1257	5	32	0
200	""	1275	6	32	0
201	""	1281	8	32	0
202	""	1288	7	32	0
203	10	1290	6	32	0
204	""	1293	7	32	0
205	""	1303	8	32	0
206	""	1303	6	32	0
207	""	1307	5	32	0
208	15	1308	4	32	0
209	""	1315	4	32	0
EOF

# confirmed:
set label "1315   " at first 209,131           left back textcolor "#ff8080"
# -~confirmed:
set label "4      " at first 209,  4*150/100   left back textcolor "#8080ff"
set label "34     " at first  70, 34*150/100+2 left back textcolor "#8080ff"
# deaths:
set label "32     " at first 209, 32*150/100   left back textcolor "#8080ff"
set label "32     " at first 194, 32*150/100+2 left back textcolor "#8080ff"
# -~deaths:
set label "0      " at first 209,  0*150/100   left back textcolor "#8080ff"
set label "1      " at first  78,  1*150/100+2 left back textcolor "#8080ff"

set multiplot
  plot $data using 0:($3/     10        ) with lines lc 7 lw 8 dt 1 title at 0.150, 0.920
replot $data using 0:($4/      1*150/100) with lines lc 6 lw 8 dt 4 title at 0.150, 0.902
replot $data using 0:($5/      1*150/100) with lines lc 6 lw 5 dt 2 title at 0.150, 0.884
replot $data using 0:($6/      1*150/100) with lines lc 6 lw 5 dt 3 title at 0.150, 0.866

# plot hor axis calendar
replot $data using 0:(0):xticlabel(2) with lines
|
File history
Click on a date/time to view the file as it appeared at that time.
| Date/Time | Thumbnail | Dimensions | User | Comment | |
|---|---|---|---|---|---|
| current | 19:17, 24 September 2020 |  | 3,300 × 1,950 (21 KB) | Jochen Burghardt (talk | contribs) | =={{int:filedesc}}== {{Information |description={{en|1=Diagram of WHO COVID-19 daily data (20 Jan - 16 Aug 2020) for ''"Total Confirmed Cases"'' (thick solid line), its smoothed increment (thick dash-dotted line), ''"Total Deaths"'' (thin dashed line), and its smoothed increment (thin dotted line); see File:WHO_Covid_2020_Jan-Aug_daily_C_Afghanistan.pdf for details.}} |date=2020-09-24 |source={{own}} |author=Jochen Burghardt |permission= |other_versions=[[:File:... |
You cannot overwrite this file.
File usage on Commons
There are no pages that use this file.