File:WHO Covid 2020 Jan-Aug daily C Kyrgyzstan.pdf
Jump to navigation
Jump to search

Size of this JPG preview of this PDF file: 800 × 473 pixels. Other resolutions: 320 × 189 pixels | 640 × 378 pixels | 1,024 × 605 pixels | 1,280 × 756 pixels | 3,300 × 1,950 pixels.
Original file (3,300 × 1,950 pixels, file size: 23 KB, MIME type: application/pdf)
Captions
Captions
Add a one-line explanation of what this file represents
Summary[edit]
| Description |
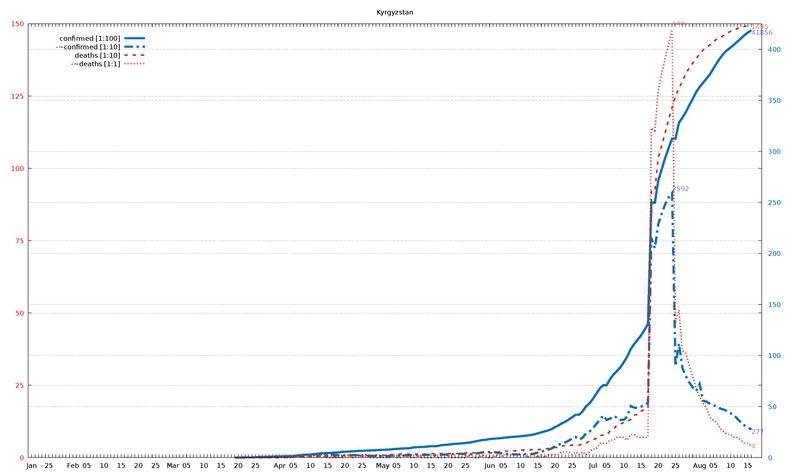
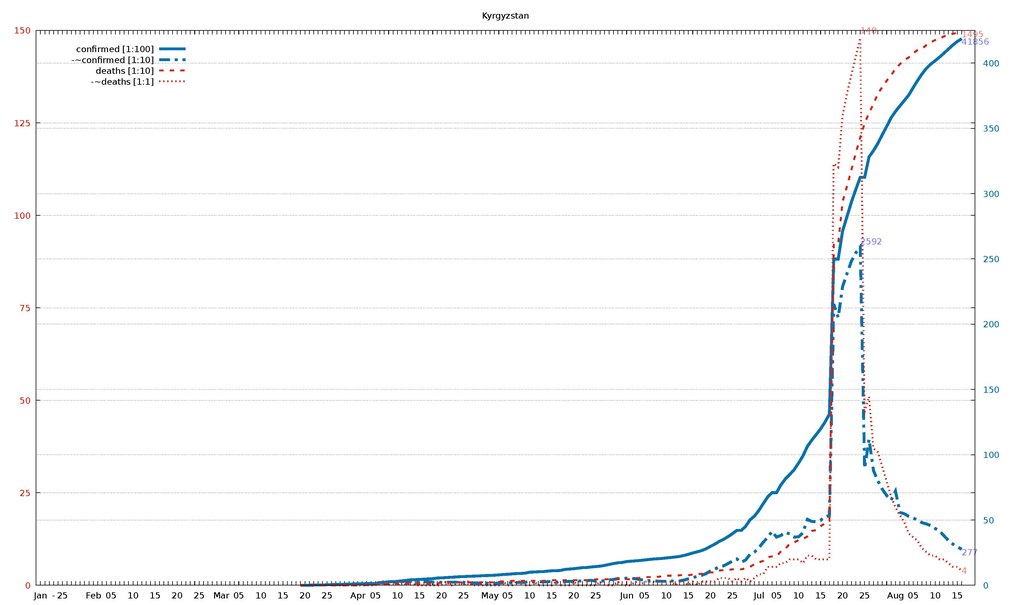
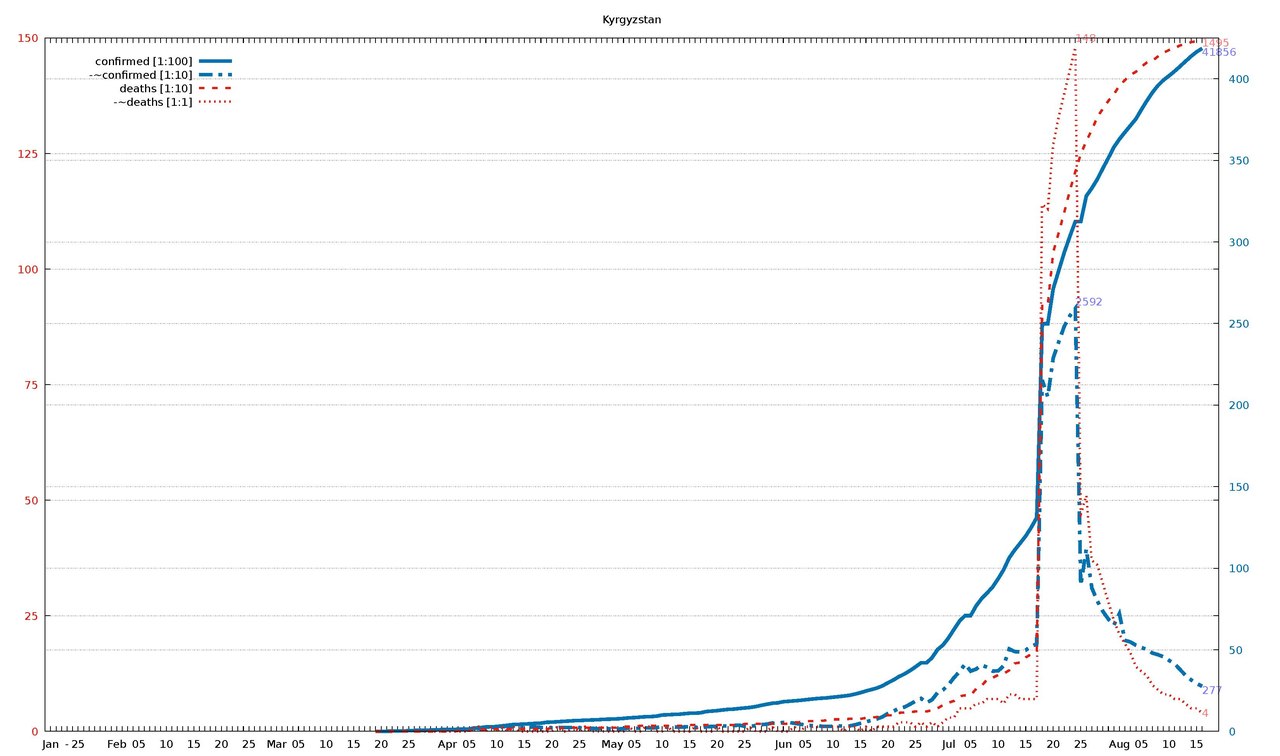
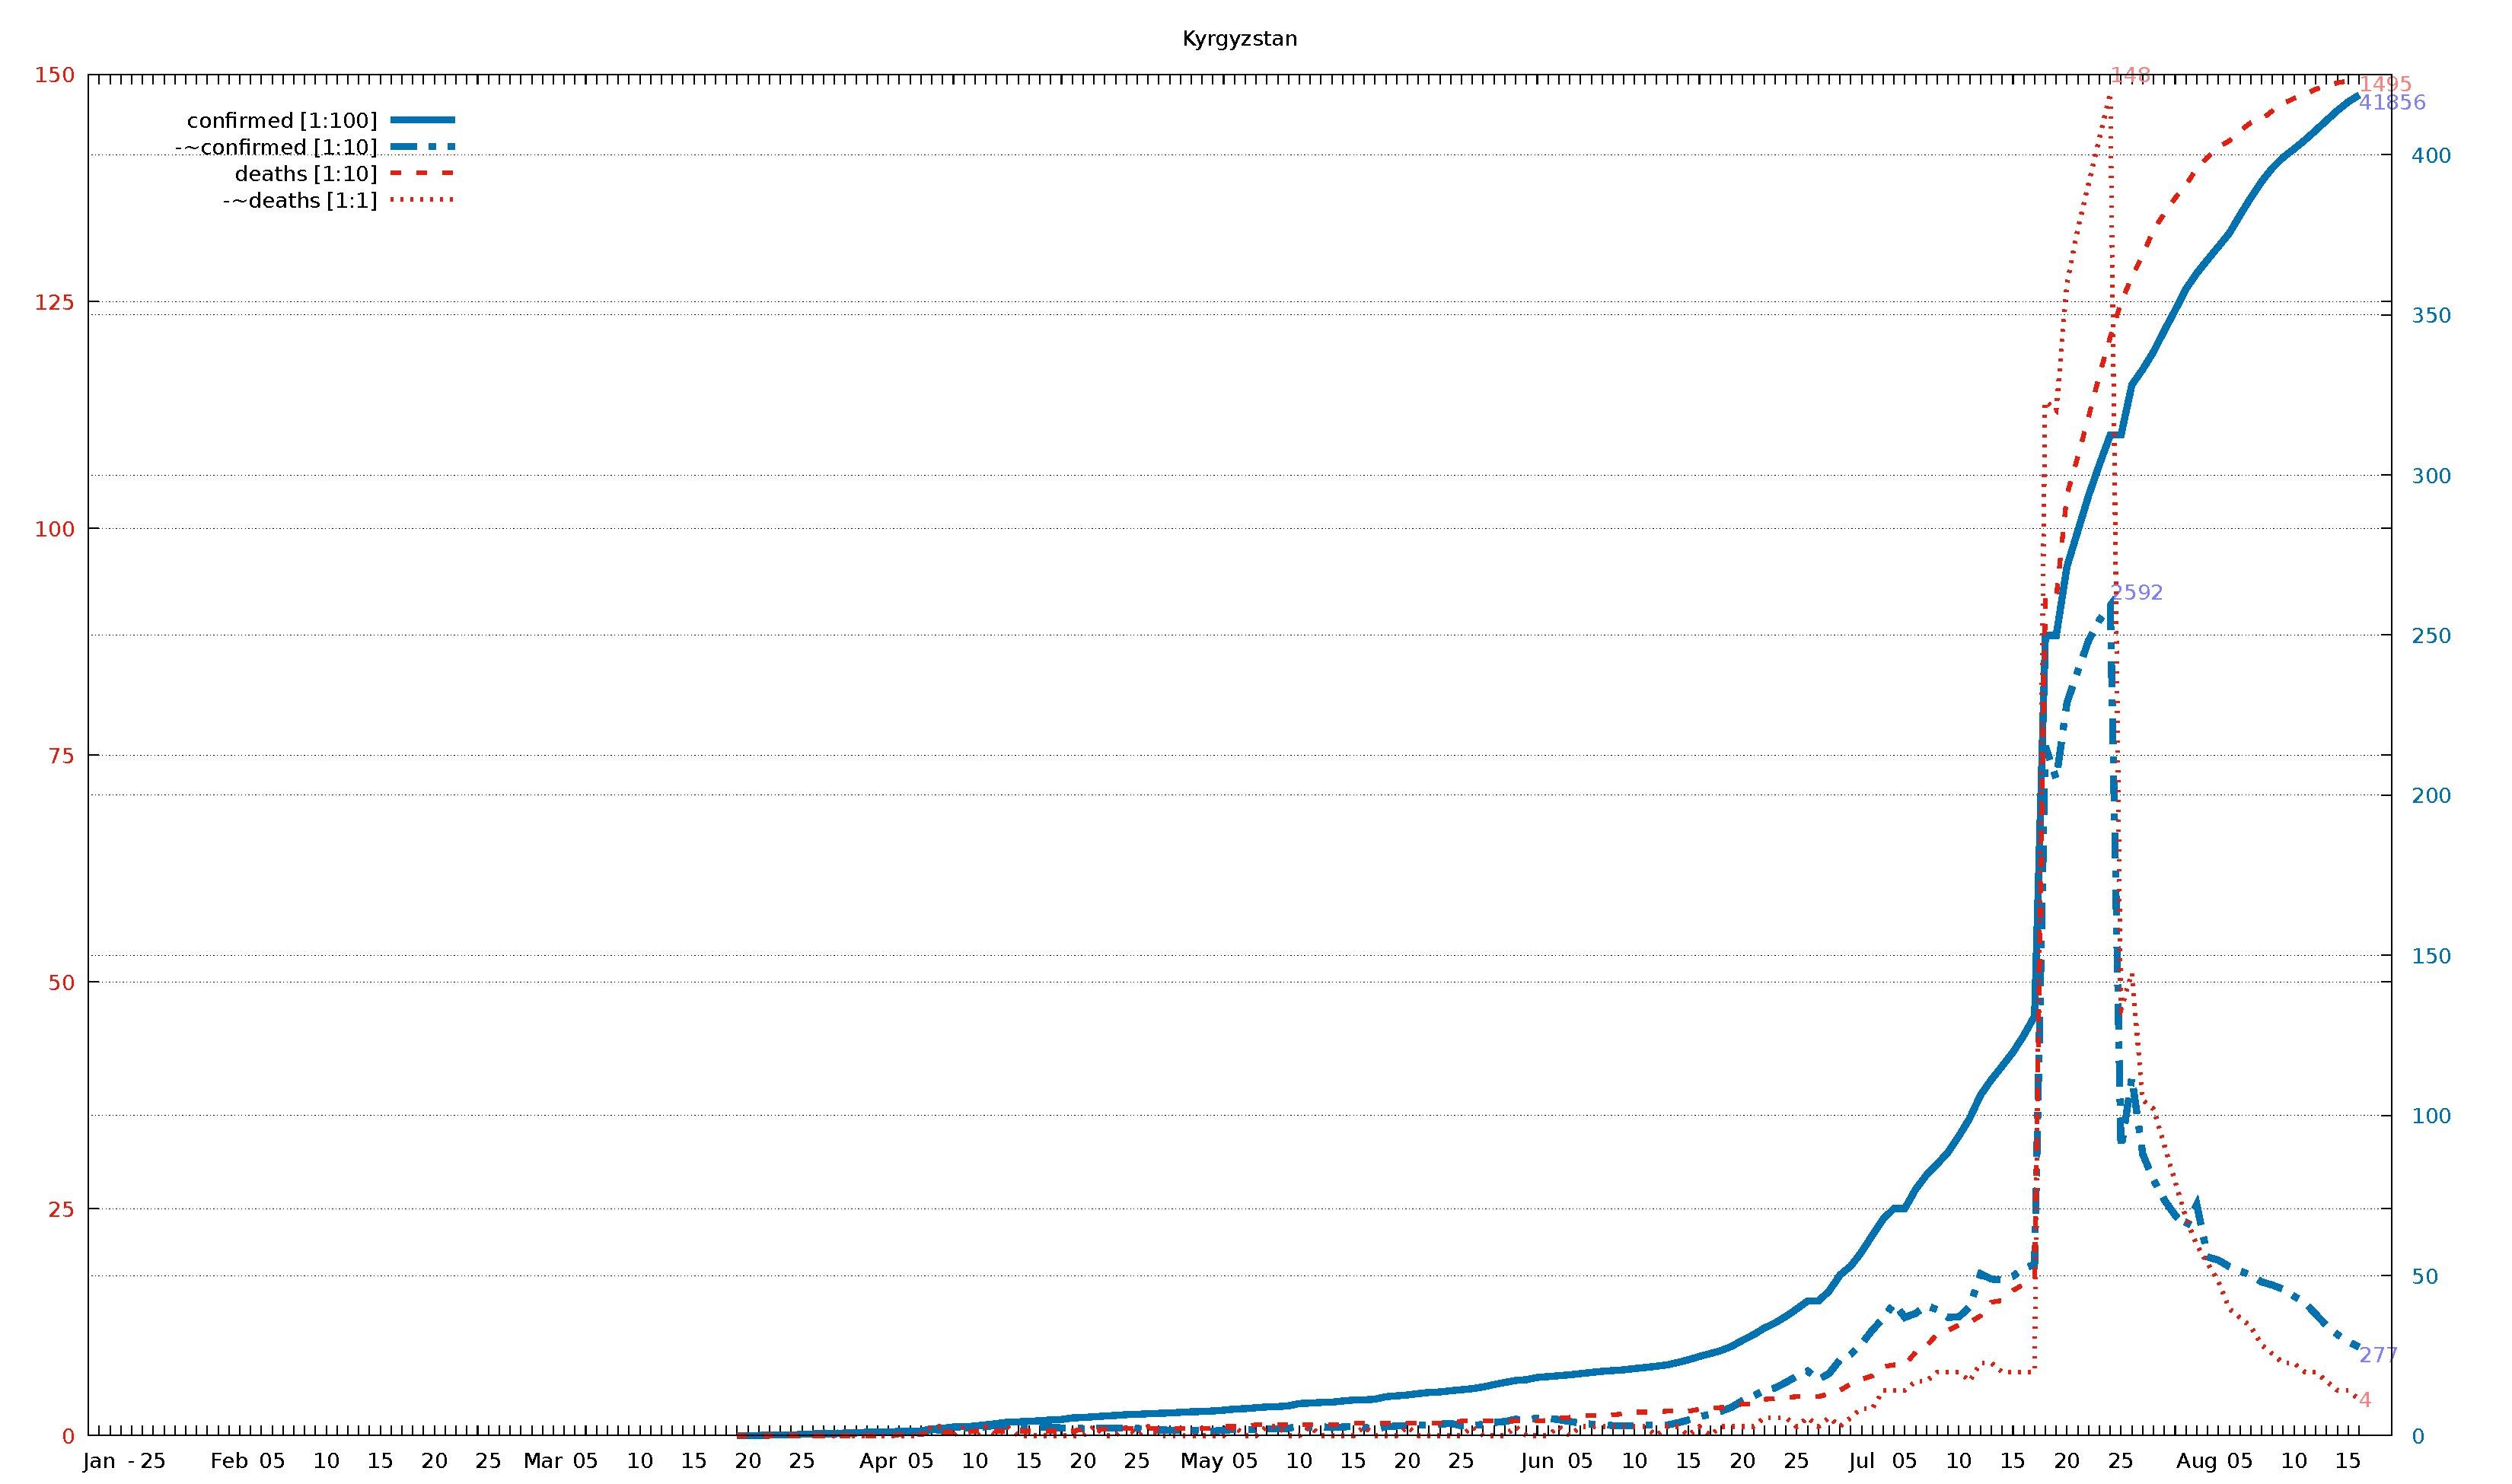
English: Diagram of WHO COVID-19 daily data (20 Jan - 16 Aug 2020) for "Total Confirmed Cases" (thick solid line), its smoothed increment (thick dash-dotted line), "Total Deaths" (thin dashed line) , and its smoothed increment (thin dotted line). Figures are taken from the available situation reports. Red and blue lines refer to the left and right vertical axis, respectively; the scaling factor for each curve is given in the legend. The horizontal axis starts on 20 Jan 2020 (situation report 1), and ends on 16 Aug 2020 (situation report 209). In the smoothed curves, for each day, 1/7 of the difference of the current day's figure and the figure a week ago is shown. For example, in situation report 115 (14 May 2020) and 121 (21 May 2020), there were 8676 and 5339 Total Confirmed Cases in Afghanistan, respectively, so the thick dash-dotted line passes through 477 = (8676-5339)/7 on 21 May.
For an overview of all related visualizations, and a more detailled description, see WHO Covid diagram set#Available country diagrams Jan-Aug 2020 (daily). |
| Date | |
| Source | Own work |
| Author | Jochen Burghardt |
Licensing[edit]
I, the copyright holder of this work, hereby publish it under the following license:
This file is licensed under the Creative Commons Attribution-Share Alike 4.0 International license.
- You are free:
- to share – to copy, distribute and transmit the work
- to remix – to adapt the work
- Under the following conditions:
- attribution – You must give appropriate credit, provide a link to the license, and indicate if changes were made. You may do so in any reasonable manner, but not in any way that suggests the licensor endorses you or your use.
- share alike – If you remix, transform, or build upon the material, you must distribute your contributions under the same or compatible license as the original.
Gnuplot source code[edit]
| Gnuplot source code |
|---|
set term pdf size 22,13
set term pdf font "sans,20"
set output "WHO_Covid_C_Kyrgyzstan.pdf"
set key autotitle columnhead
set termoption noenhanced
# (1) norm: 419 260 150 148
# (2) dist: 1,0:162 2,0:280 2,1:174 3,0:284 3,1:176 3,2:102
# (3,4) dist max: 284 3:148--0:419
# (4) right: 1 1 0 0
# (6,7) scMax: 150 425
# (8) scale: [1:100] [1:10] [1:10] [1:1]


set xrange [-1:212]
set yrange [0:150]
set y2range [0:425]
set xtics 3650,100
set ytics 25 textcolor "#e51e10"
set y2tics 50 textcolor "#0072b2"
set grid y y2

set title "Kyrgyzstan"

$data <<EOF
rep day "confirmed [1:100]" "-~confirmed [1:10]" "deaths [1:10]" "-~deaths [1:1]"
1	Jan	.	-	.	-
2	""	.	-	.	-
3	""	.	-	.	-
-	-	-	-	-	-
4	""	.	-	.	-
5	25	.	-	.	-
6	""	.	-	.	-
7	""	.	-	.	-
8	""	.	-	.	-
9	""	.	-	.	-
10	""	.	-	.	-
11	""	.	-	.	-
12	Feb	.	-	.	-
13	""	.	-	.	-
14	""	.	-	.	-
15	""	.	-	.	-
16	05	.	-	.	-
17	""	.	-	.	-
18	""	.	-	.	-
19	""	.	-	.	-
20	""	.	-	.	-
21	10	.	-	.	-
22	""	.	-	.	-
23	""	.	-	.	-
24	""	.	-	.	-
25	""	.	-	.	-
26	15	.	-	.	-
27	""	.	-	.	-
28	""	.	-	.	-
29	""	.	-	.	-
30	""	.	-	.	-
31	20	.	-	.	-
32	""	.	-	.	-
33	""	.	-	.	-
34	""	.	-	.	-
35	""	.	-	.	-
36	25	.	-	.	-
37	""	.	-	.	-
38	""	.	-	.	-
39	""	.	-	.	-
40	""	.	-	.	-
41	Mar	.	-	.	-
42	""	.	-	.	-
43	""	.	-	.	-
44	""	.	-	.	-
45	05	.	-	.	-
46	""	.	-	.	-
47	""	.	-	.	-
48	""	.	-	.	-
49	""	.	-	.	-
50	10	.	-	.	-
51	""	.	-	.	-
52	""	.	-	.	-
53	""	.	-	.	-
54	""	.	-	.	-
55	15	.	-	.	-
56	""	.	-	.	-
57	""	.	-	.	-
58	""	.	-	.	-
59	""	3	-	0	-
60	20	3	-	0	-
61	""	6	-	0	-
62	""	14	-	0	-
63	""	14	-	0	-
64	""	16	-	0	-
65	25	42	-	0	-
66	""	44	6	0	0
67	""	58	8	0	0
68	""	58	7	0	0
69	""	84	10	0	0
70	""	84	10	0	0
71	""	107	13	0	0
72	Apr	111	10	0	0
73	""	115	10	0	0
74	""	130	10	1	0
75	""	144	13	1	0
76	05	147	9	1	0
77	""	216	19	4	1
78	""	228	17	4	1
79	""	270	23	4	0
80	""	280	23	4	1
81	10	298	24	5	0
82	""	339	28	5	1
83	""	377	33	5	0
84	""	419	29	5	1
85	""	430	29	5	0
86	15	449	25	5	0
87	""	466	27	5	0
88	""	489	27	5	0
89	""	506	24	5	0
90	""	554	25	5	0
91	20	568	22	7	0
92	""	590	22	7	1
93	""	612	24	7	0
94	""	631	23	8	0
95	""	656	24	8	1
96	25	665	23	8	0
97	""	682	18	8	1
98	""	695	18	8	0
99	""	708	17	8	0
100	""	729	17	8	0
101	""	746	16	8	0
102	May	756	15	8	0
103	""	769	14	8	0
104	""	795	17	10	0
105	""	830	19	10	1
106	05	843	19	10	0
107	""	871	20	12	0
108	""	895	22	12	1
109	""	906	21	12	1
110	""	931	23	12	0
111	10	1002	30	12	0
112	""	1016	26	12	1
113	""	1037	28	12	0
114	""	1044	25	12	0
115	""	1082	27	12	0
116	15	1111	29	14	0
117	""	1117	26	14	1
118	""	1138	20	14	0
119	""	1216	28	14	0
120	""	1243	30	14	0
121	20	1270	32	14	1
122	""	1313	33	14	0
123	""	1350	34	14	0
124	""	1365	36	14	0
125	""	1403	38	14	0
126	25	1433	31	16	0
127	""	1468	32	16	1
128	""	1520	35	16	0
129	""	1594	41	16	0
130	""	1662	44	16	0
131	""	1722	51	16	1
132	""	1748	49	16	0
133	Jun	1817	55	16	0
134	""	1845	54	17	0
135	""	1871	50	20	1
136	""	1899	44	20	0
137	05	1936	39	22	1
138	""	1974	36	22	1
139	""	2007	37	22	1
140	""	2032	31	23	1
141	""	2055	30	24	1
142	10	2093	31	26	1
143	""	2129	33	26	1
144	""	2166	33	26	0
145	""	2207	33	27	1
146	""	2285	40	27	1
147	15	2372	49	27	0
148	""	2472	59	29	1
149	""	2562	67	30	0
150	""	2657	76	31	1
151	""	2789	89	32	1
152	20	2981	110	35	1
153	""	3151	124	35	1
154	""	3356	141	40	2
155	""	3519	149	41	2
156	""	3726	166	42	2
157	25	3954	186	43	1
158	""	4204	202	43	2
159	""	4204	175	43	1
160	""	4513	194	46	2
161	""	5017	237	50	1
162	""	5296	254	57	2
163	Jul	5735	287	62	3
164	""	6261	330	66	3
165	""	6767	366	76	5
166	""	7094	413	78	5
167	05	7094	369	78	5
168	""	7691	382	92	6
169	""	8141	406	99	6
170	""	8486	393	112	7
171	""	8847	369	116	7
172	10	9358	371	122	7
173	""	9910	402	125	6
174	""	10629	505	132	8
175	""	11117	489	147	8
176	""	11538	486	149	7
177	15	11977	498	160	7
178	""	12498	522	167	7
179	""	13101	535	172	7
180	""	24984	2153	923	114
181	""	24984	2051	923	113
182	20	27143	2289	1037	127
183	""	28251	2388	1079	133
184	""	29359	2483	1123	138
185	""	30326	2547	1169	143
186	""	31247	2592	1211	148
187	25	31247	895	1249	47
188	""	32813	1118	1277	51
189	""	33296	879	1301	37
190	""	33844	799	1329	36
191	""	34512	736	1347	32
192	""	35143	688	1364	28
193	""	35805	652	1378	24
194	Aug	36299	721	1397	21
195	""	36719	558	1409	19
196	""	37129	548	1420	17
197	""	37541	528	1427	14
198	05	38110	514	1438	13
199	""	38659	502	1447	12
200	""	39162	480	1451	10
201	""	39587	470	1460	9
202	""	39919	457	1468	8
203	10	40177	435	1474	8
204	""	40455	416	1478	7
205	""	40759	379	1484	7
206	""	41069	344	1487	6
207	""	41373	316	1491	5
208	15	41645	294	1493	5
209	""	41856	277	1495	4
EOF

# confirmed:
set label "41856  " at first 209,418*150/425   left back textcolor "#8080ff"
# -~confirmed:
set label "277    " at first 209, 27*150/425   left back textcolor "#8080ff"
set label "2592   " at first 186,259*150/425+2 left back textcolor "#8080ff"
# deaths:
set label "1495   " at first 209,149           left back textcolor "#ff8080"
# -~deaths:
set label "4      " at first 209,  4           left back textcolor "#ff8080"
set label "148    " at first 186,148        +2 left back textcolor "#ff8080"

set multiplot
  plot $data using 0:($3/    100*150/425) with lines lc 6 lw 8 dt 1 title at 0.150, 0.920
replot $data using 0:($4/     10*150/425) with lines lc 6 lw 8 dt 4 title at 0.150, 0.902
replot $data using 0:($5/     10        ) with lines lc 7 lw 5 dt 2 title at 0.150, 0.884
replot $data using 0:($6/      1        ) with lines lc 7 lw 5 dt 3 title at 0.150, 0.866

# plot hor axis calendar
replot $data using 0:(0):xticlabel(2) with lines
|
File history
Click on a date/time to view the file as it appeared at that time.
| Date/Time | Thumbnail | Dimensions | User | Comment | |
|---|---|---|---|---|---|
| current | 19:17, 24 September 2020 |  | 3,300 × 1,950 (23 KB) | Jochen Burghardt (talk | contribs) | =={{int:filedesc}}== {{Information |description={{en|1=Diagram of WHO COVID-19 daily data (20 Jan - 16 Aug 2020) for ''"Total Confirmed Cases"'' (thick solid line), its smoothed increment (thick dash-dotted line), ''"Total Deaths"'' (thin dashed line), and its smoothed increment (thin dotted line); see File:WHO_Covid_2020_Jan-Aug_daily_C_Afghanistan.pdf for details.}} |date=2020-09-24 |source={{own}} |author=Jochen Burghardt |permission= |other_versions=[[:File:... |
You cannot overwrite this file.
File usage on Commons
There are no pages that use this file.