File:WHO Covid 2020 Jan-Aug daily C Kuwait.pdf
Jump to navigation
Jump to search

Size of this JPG preview of this PDF file: 800 × 473 pixels. Other resolutions: 320 × 189 pixels | 640 × 378 pixels | 1,024 × 605 pixels | 1,280 × 756 pixels | 3,300 × 1,950 pixels.
Original file (3,300 × 1,950 pixels, file size: 24 KB, MIME type: application/pdf)
Captions
Captions
Add a one-line explanation of what this file represents
Summary[edit]
| Description |
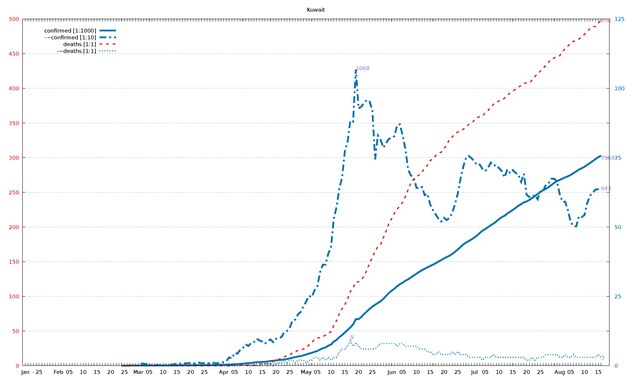
English: Diagram of WHO COVID-19 daily data (20 Jan - 16 Aug 2020) for "Total Confirmed Cases" (thick solid line), its smoothed increment (thick dash-dotted line), "Total Deaths" (thin dashed line) , and its smoothed increment (thin dotted line). Figures are taken from the available situation reports. Red and blue lines refer to the left and right vertical axis, respectively; the scaling factor for each curve is given in the legend. The horizontal axis starts on 20 Jan 2020 (situation report 1), and ends on 16 Aug 2020 (situation report 209). In the smoothed curves, for each day, 1/7 of the difference of the current day's figure and the figure a week ago is shown. For example, in situation report 115 (14 May 2020) and 121 (21 May 2020), there were 8676 and 5339 Total Confirmed Cases in Afghanistan, respectively, so the thick dash-dotted line passes through 477 = (8676-5339)/7 on 21 May.
For an overview of all related visualizations, and a more detailled description, see WHO Covid diagram set#Available country diagrams Jan-Aug 2020 (daily). |
| Date | |
| Source | Own work |
| Author | Jochen Burghardt |
Licensing[edit]
I, the copyright holder of this work, hereby publish it under the following license:
This file is licensed under the Creative Commons Attribution-Share Alike 4.0 International license.
- You are free:
- to share – to copy, distribute and transmit the work
- to remix – to adapt the work
- Under the following conditions:
- attribution – You must give appropriate credit, provide a link to the license, and indicate if changes were made. You may do so in any reasonable manner, but not in any way that suggests the licensor endorses you or your use.
- share alike – If you remix, transform, or build upon the material, you must distribute your contributions under the same or compatible license as the original.
Gnuplot source code[edit]
| Gnuplot source code |
|---|
set term pdf size 22,13
set term pdf font "sans,20"
set output "WHO_Covid_C_Kuwait.pdf"
set key autotitle columnhead
set termoption noenhanced
# (1) norm: 757 107 498 001
# (2) dist: 1,0:141 2,0:152 2,1:214
# (3,4) dist max: 214 2:498--1:107
# (4) right: 1 1 0 1
# (6,7) scMax: 500 125
# (8) scale: [1:1000] [1:10] [1:1] [1:1]


set xrange [-1:212]
set yrange [0:500]
set y2range [0:125]
set xtics 3650,100
set ytics 50 textcolor "#e51e10"
set y2tics 25 textcolor "#0072b2"
set grid y y2

set title "Kuwait"

$data <<EOF
rep day "confirmed [1:1000]" "-~confirmed [1:10]" "deaths [1:1]" "-~deaths [1:1]"
1	Jan	.	-	.	-
2	""	.	-	.	-
3	""	.	-	.	-
-	-	-	-	-	-
4	""	.	-	.	-
5	25	.	-	.	-
6	""	.	-	.	-
7	""	.	-	.	-
8	""	.	-	.	-
9	""	.	-	.	-
10	""	.	-	.	-
11	""	.	-	.	-
12	Feb	.	-	.	-
13	""	.	-	.	-
14	""	.	-	.	-
15	""	.	-	.	-
16	05	.	-	.	-
17	""	.	-	.	-
18	""	.	-	.	-
19	""	.	-	.	-
20	""	.	-	.	-
21	10	.	-	.	-
22	""	.	-	.	-
23	""	.	-	.	-
24	""	.	-	.	-
25	""	.	-	.	-
26	15	.	-	.	-
27	""	.	-	.	-
28	""	.	-	.	-
29	""	.	-	.	-
30	""	.	-	.	-
31	20	.	-	.	-
32	""	.	-	.	-
33	""	.	-	.	-
34	""	.	-	.	-
35	""	3	-	0	-
36	25	8	-	0	-
37	""	12	-	0	-
38	""	43	-	0	-
39	""	43	-	0	-
40	""	45	-	0	-
41	Mar	45	-	0	-
42	""	56	8	0	0
43	""	56	7	0	0
44	""	56	6	0	0
45	05	58	2	0	0
46	""	58	2	0	0
47	""	58	2	0	0
48	""	62	3	0	0
49	""	64	1	0	0
50	10	65	1	0	0
51	""	69	2	0	0
52	""	80	3	0	0
53	""	80	3	0	0
54	""	100	6	0	0
55	15	112	7	0	0
56	""	112	7	0	0
57	""	130	10	0	0
58	""	130	8	0	0
59	""	142	9	0	0
60	20	148	10	0	0
61	""	159	8	0	0
62	""	176	9	0	0
63	""	189	11	0	0
64	""	191	9	0	0
65	25	195	9	0	0
66	""	208	10	0	0
67	""	208	8	0	0
68	""	235	11	0	0
69	""	235	9	0	0
70	""	255	9	0	0
71	""	266	11	0	0
72	Apr	289	13	0	0
73	""	317	16	0	0
74	""	417	30	0	0
75	""	417	26	0	0
76	05	556	46	1	0
77	""	556	43	1	0
78	""	665	57	1	0
79	""	743	64	1	1
80	""	855	77	1	0
81	10	910	71	1	0
82	""	993	82	1	0
83	""	1154	85	1	0
84	""	1234	97	1	0
85	""	1300	91	2	0
86	15	1355	87	3	0
87	""	1405	79	3	1
88	""	1524	88	3	0
89	""	1658	95	5	1
90	""	1751	85	6	0
91	20	1915	97	7	1
92	""	1995	100	9	1
93	""	2080	103	11	1
94	""	2248	121	13	2
95	""	2399	125	14	1
96	25	2614	136	15	2
97	""	2892	163	19	2
98	""	3075	166	20	1
99	""	3288	185	22	2
100	""	3440	194	23	2
101	""	3740	213	24	2
102	May	4024	232	26	1
103	""	4377	252	30	2
104	""	4619	247	33	2
105	""	4983	272	38	3
106	05	5278	285	40	3
107	""	5804	337	40	2
108	""	6289	364	42	3
109	""	6567	364	44	2
110	""	7208	404	47	3
111	10	7623	429	49	2
112	""	8688	530	58	3
113	""	9286	572	65	3
114	""	10277	639	75	5
115	""	11028	677	82	6
116	15	11975	773	88	6
117	""	12860	807	96	7
118	""	13802	883	107	9
119	""	14850	880	112	7
120	""	16764	1068	121	8
121	20	16764	927	121	7
122	""	17568	934	124	6
123	""	18609	948	129	6
124	""	19564	958	138	6
125	""	20464	952	148	6
126	25	21302	921	156	6
127	""	21967	744	165	6
128	""	22575	830	172	7
129	""	23267	814	175	8
130	""	24112	786	185	8
131	""	25184	803	194	8
132	""	26192	818	205	8
133	Jun	27043	820	212	8
134	""	27762	828	220	8
135	""	28649	868	226	7
136	""	29359	870	230	8
137	05	29921	830	236	8
138	""	30644	780	244	7
139	""	31131	706	254	7
140	""	31848	686	264	7
141	""	32510	678	269	7
142	10	33140	642	273	7
143	""	33823	638	275	6
144	""	34432	644	279	6
145	""	34952	615	285	6
146	""	35466	620	289	5
147	15	35920	581	296	5
148	""	36431	561	298	4
149	""	36958	545	303	4
150	""	37533	530	306	5
151	""	38074	520	308	4
152	20	38678	533	313	4
153	""	39145	525	319	4
154	""	39650	533	326	4
155	""	40291	551	330	5
156	""	41033	583	334	4
157	25	41879	620	337	5
158	""	42788	674	339	4
159	""	43703	718	341	4
160	""	44391	749	344	4
161	""	44942	756	348	3
162	""	45524	748	350	3
163	Jul	46195	737	354	3
164	""	46940	723	358	3
165	""	47859	725	359	3
166	""	48672	709	360	2
167	05	49303	702	365	3
168	""	49941	714	368	3
169	""	50644	732	373	3
170	""	51245	721	377	4
171	""	52007	724	379	3
172	10	52840	712	382	3
173	""	53580	701	383	3
174	""	54058	679	386	3
175	""	54894	708	390	3
176	""	55508	694	393	3
177	15	56174	705	396	3
178	""	56877	695	399	3
179	""	57668	690	402	3
180	""	58221	663	404	3
181	""	58904	692	407	3
182	20	59204	616	408	2
183	""	59763	608	408	2
184	""	60434	608	412	3
185	""	61185	616	417	2
186	""	61872	600	421	3
187	25	62625	630	425	3
188	""	63309	629	429	3
189	""	63773	653	433	4
190	""	64379	659	438	4
191	""	65149	674	442	4
192	""	65903	674	444	4
193	""	66529	665	445	4
194	Aug	66957	619	447	3
195	""	67448	591	453	3
196	""	67911	591	457	4
197	""	68299	560	461	3
198	05	68774	518	465	3
199	""	69425	503	468	4
200	""	70045	502	469	3
201	""	70727	539	471	3
202	""	71199	536	474	3
203	10	71713	543	478	3
204	""	72400	586	482	3
205	""	73068	613	486	3
206	""	73785	623	489	3
207	""	74486	635	489	3
208	15	75185	636	494	4
209	""	75697	643	498	3
EOF

# confirmed:
set label "75697  " at first 209, 75*500/125   left back textcolor "#8080ff"
# -~confirmed:
set label "643    " at first 209, 64*500/125   left back textcolor "#8080ff"
set label "1068   " at first 120,106*500/125+5 left back textcolor "#8080ff"
# deaths:
set label "498    " at first 209,498           left back textcolor "#ff8080"
# -~deaths:
set label "3      " at first 209,  3*500/125   left back textcolor "#8080ff"
set label "9      " at first 118,  9*500/125+5 left back textcolor "#8080ff"

set multiplot
  plot $data using 0:($3/   1000*500/125) with lines lc 6 lw 8 dt 1 title at 0.150, 0.920
replot $data using 0:($4/     10*500/125) with lines lc 6 lw 8 dt 4 title at 0.150, 0.902
replot $data using 0:($5/      1        ) with lines lc 7 lw 5 dt 2 title at 0.150, 0.884
replot $data using 0:($6/      1*500/125) with lines lc 6 lw 5 dt 3 title at 0.150, 0.866

# plot hor axis calendar
replot $data using 0:(0):xticlabel(2) with lines
|
File history
Click on a date/time to view the file as it appeared at that time.
| Date/Time | Thumbnail | Dimensions | User | Comment | |
|---|---|---|---|---|---|
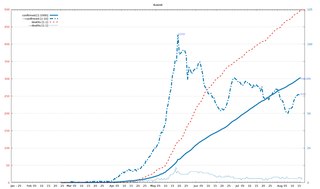
| current | 19:16, 24 September 2020 |  | 3,300 × 1,950 (24 KB) | Jochen Burghardt (talk | contribs) | =={{int:filedesc}}== {{Information |description={{en|1=Diagram of WHO COVID-19 daily data (20 Jan - 16 Aug 2020) for ''"Total Confirmed Cases"'' (thick solid line), its smoothed increment (thick dash-dotted line), ''"Total Deaths"'' (thin dashed line), and its smoothed increment (thin dotted line); see File:WHO_Covid_2020_Jan-Aug_daily_C_Afghanistan.pdf for details.}} |date=2020-09-24 |source={{own}} |author=Jochen Burghardt |permission= |other_versions=[[:File:... |
You cannot overwrite this file.
File usage on Commons
There are no pages that use this file.