File:WHO Covid 2020 Jan-Aug daily C Kazakhstan.pdf
Jump to navigation
Jump to search

Size of this JPG preview of this PDF file: 800 × 473 pixels. Other resolutions: 320 × 189 pixels | 640 × 378 pixels | 1,024 × 605 pixels | 1,280 × 756 pixels | 3,300 × 1,950 pixels.
Original file (3,300 × 1,950 pixels, file size: 23 KB, MIME type: application/pdf)
Captions
Captions
Add a one-line explanation of what this file represents
Summary[edit]
| Description |
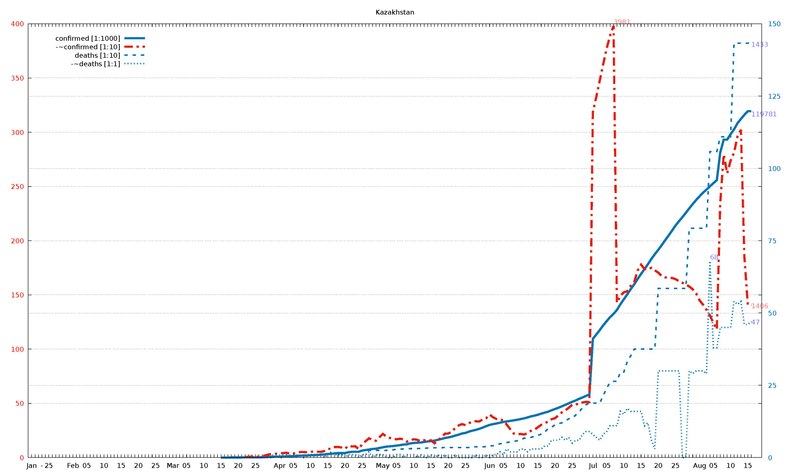
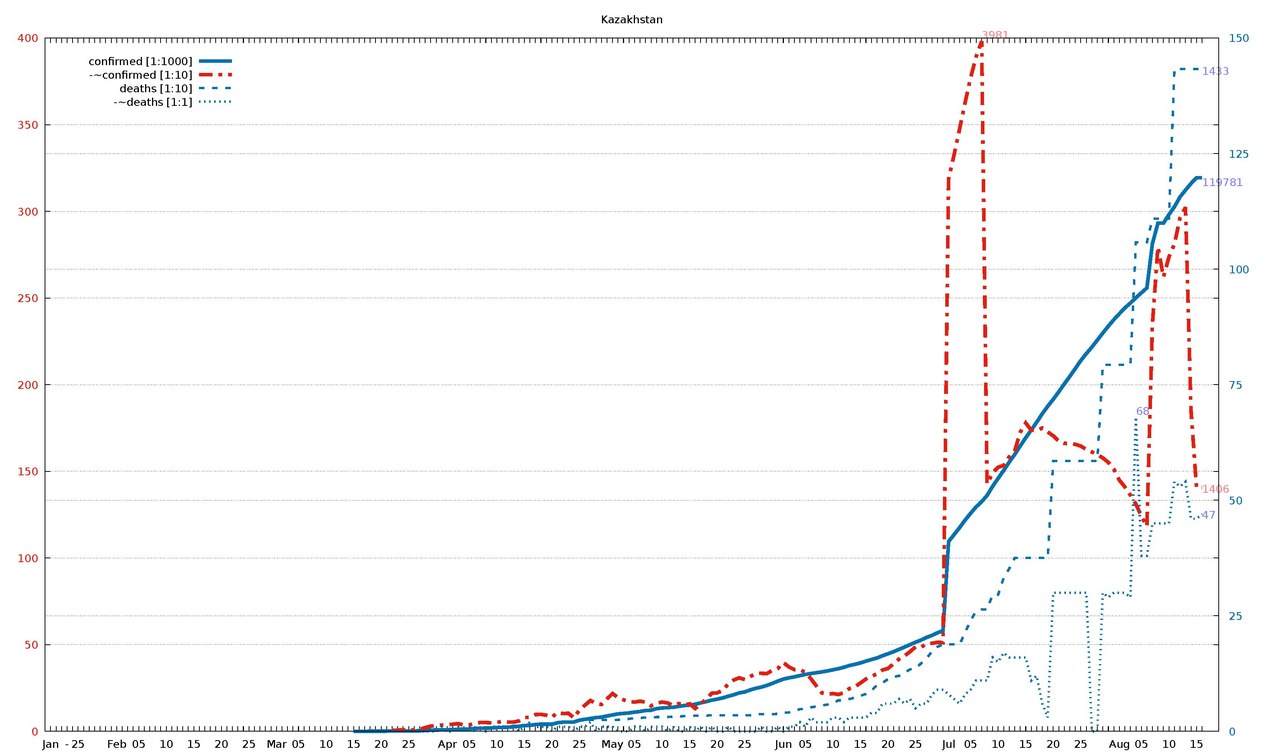
English: Diagram of WHO COVID-19 daily data (20 Jan - 16 Aug 2020) for "Total Confirmed Cases" (thick solid line), its smoothed increment (thick dash-dotted line), "Total Deaths" (thin dashed line) , and its smoothed increment (thin dotted line). Figures are taken from the available situation reports. Red and blue lines refer to the left and right vertical axis, respectively; the scaling factor for each curve is given in the legend. The horizontal axis starts on 20 Jan 2020 (situation report 1), and ends on 16 Aug 2020 (situation report 209). In the smoothed curves, for each day, 1/7 of the difference of the current day's figure and the figure a week ago is shown. For example, in situation report 115 (14 May 2020) and 121 (21 May 2020), there were 8676 and 5339 Total Confirmed Cases in Afghanistan, respectively, so the thick dash-dotted line passes through 477 = (8676-5339)/7 on 21 May.
For an overview of all related visualizations, and a more detailled description, see WHO Covid diagram set#Available country diagrams Jan-Aug 2020 (daily). |
| Date | |
| Source | Own work |
| Author | Jochen Burghardt |
Licensing[edit]
I, the copyright holder of this work, hereby publish it under the following license:
This file is licensed under the Creative Commons Attribution-Share Alike 4.0 International license.
- You are free:
- to share – to copy, distribute and transmit the work
- to remix – to adapt the work
- Under the following conditions:
- attribution – You must give appropriate credit, provide a link to the license, and indicate if changes were made. You may do so in any reasonable manner, but not in any way that suggests the licensor endorses you or your use.
- share alike – If you remix, transform, or build upon the material, you must distribute your contributions under the same or compatible license as the original.
Gnuplot source code[edit]
| Gnuplot source code |
|---|
set term pdf size 22,13
set term pdf font "sans,20"
set output "WHO_Covid_C_Kazakhstan.pdf"
set key autotitle columnhead
set termoption noenhanced
# (1) norm: 120 399 144 001
# (2) dist: 1,0:300 2,0:120 2,1:277
# (3,4) dist max: 300 1:399--0:120
# (4) right: 1 0 1 1
# (6,7) scMax: 400 150
# (8) scale: [1:1000] [1:10] [1:10] [1:1]


set xrange [-1:212]
set yrange [0:400]
set y2range [0:150]
set xtics 3650,100
set ytics 50 textcolor "#e51e10"
set y2tics 25 textcolor "#0072b2"
set grid y y2

set title "Kazakhstan"

$data <<EOF
rep day "confirmed [1:1000]" "-~confirmed [1:10]" "deaths [1:10]" "-~deaths [1:1]"
1	Jan	.	-	.	-
2	""	.	-	.	-
3	""	.	-	.	-
-	-	-	-	-	-
4	""	.	-	.	-
5	25	.	-	.	-
6	""	.	-	.	-
7	""	.	-	.	-
8	""	.	-	.	-
9	""	.	-	.	-
10	""	.	-	.	-
11	""	.	-	.	-
12	Feb	.	-	.	-
13	""	.	-	.	-
14	""	.	-	.	-
15	""	.	-	.	-
16	05	.	-	.	-
17	""	.	-	.	-
18	""	.	-	.	-
19	""	.	-	.	-
20	""	.	-	.	-
21	10	.	-	.	-
22	""	.	-	.	-
23	""	.	-	.	-
24	""	.	-	.	-
25	""	.	-	.	-
26	15	.	-	.	-
27	""	.	-	.	-
28	""	.	-	.	-
29	""	.	-	.	-
30	""	.	-	.	-
31	20	.	-	.	-
32	""	.	-	.	-
33	""	.	-	.	-
34	""	.	-	.	-
35	""	.	-	.	-
36	25	.	-	.	-
37	""	.	-	.	-
38	""	.	-	.	-
39	""	.	-	.	-
40	""	.	-	.	-
41	Mar	.	-	.	-
42	""	.	-	.	-
43	""	.	-	.	-
44	""	.	-	.	-
45	05	.	-	.	-
46	""	.	-	.	-
47	""	.	-	.	-
48	""	.	-	.	-
49	""	.	-	.	-
50	10	.	-	.	-
51	""	.	-	.	-
52	""	.	-	.	-
53	""	.	-	.	-
54	""	.	-	.	-
55	15	6	-	0	-
56	""	6	-	0	-
57	""	6	-	0	-
58	""	33	-	0	-
59	""	36	-	0	-
60	20	46	-	0	-
61	""	53	-	0	-
62	""	56	7	0	0
63	""	60	7	0	0
64	""	63	9	0	0
65	25	79	6	0	0
66	""	97	9	0	0
67	""	125	11	0	0
68	""	204	22	1	0
69	""	265	30	1	0
70	""	294	33	1	0
71	""	312	36	1	1
72	Apr	348	38	2	0
73	""	386	41	3	0
74	""	435	45	3	1
75	""	460	36	3	0
76	05	531	38	5	1
77	""	604	44	5	0
78	""	670	52	6	1
79	""	709	51	6	0
80	""	727	49	7	1
81	10	802	52	9	1
82	""	859	57	10	1
83	""	897	53	10	1
84	""	979	53	12	1
85	""	1091	60	12	0
86	15	1275	81	12	1
87	""	1295	81	16	2
88	""	1480	97	16	1
89	""	1546	98	17	1
90	""	1546	93	17	1
91	20	1546	81	17	0
92	""	1852	109	19	1
93	""	1995	103	19	1
94	""	2025	104	19	1
95	""	2025	78	19	0
96	25	2416	124	25	1
97	""	2601	151	25	1
98	""	2791	178	25	2
99	""	2982	161	25	0
100	""	3078	155	25	1
101	""	3333	187	25	1
102	May	3551	218	25	1
103	""	3785	195	25	0
104	""	3877	182	26	0
105	""	3988	171	27	0
106	05	4160	169	29	1
107	""	4298	174	29	1
108	""	4509	168	30	0
109	""	4578	147	30	1
110	""	4922	162	31	1
111	10	5056	169	31	1
112	""	5138	164	31	0
113	""	5207	149	32	1
114	""	5417	160	32	0
115	""	5571	152	33	0
116	15	5689	159	34	1
117	""	5850	132	34	0
118	""	6157	158	34	1
119	""	6440	186	34	0
120	""	6751	220	35	1
121	20	6969	222	35	0
122	""	7234	237	35	0
123	""	7597	273	35	1
124	""	7919	296	35	0
125	""	8322	309	35	0
126	25	8531	299	35	0
127	""	8969	316	35	0
128	""	9304	334	37	0
129	""	9576	335	37	1
130	""	9932	333	37	0
131	""	10382	352	37	0
132	""	10858	362	38	1
133	Jun	11308	397	41	0
134	""	11571	372	41	1
135	""	11796	356	44	1
136	""	12067	356	48	2
137	05	12312	340	48	1
138	""	12511	304	52	3
139	""	12694	262	54	2
140	""	12859	222	56	2
141	""	13074	214	58	2
142	10	13319	218	61	3
143	""	13559	213	67	3
144	""	13872	223	67	2
145	""	14238	247	70	3
146	""	14496	257	73	3
147	15	14809	279	77	3
148	""	15192	302	81	3
149	""	15542	318	88	4
150	""	15877	331	100	4
151	""	16351	354	105	6
152	20	16779	363	113	6
153	""	17225	390	118	6
154	""	17732	417	120	7
155	""	18231	435	127	6
156	""	18765	460	134	7
157	25	19285	487	136	5
158	""	19750	485	147	6
159	""	20319	506	158	6
160	""	20780	508	173	8
161	""	21327	514	183	9
162	""	21819	512	188	9
163	Jul	41065	3186	188	8
164	""	42574	3327	188	7
165	""	44075	3475	188	6
166	""	45719	3628	214	8
167	05	47171	3771	240	9
168	""	48574	3892	260	11
169	""	49683	3981	264	11
170	""	51059	1427	264	11
171	""	53021	1493	296	16
172	10	54747	1524	296	15
173	""	56455	1534	332	17
174	""	58253	1583	352	16
175	""	59899	1618	375	16
176	""	61755	1725	375	16
177	15	63514	1779	375	16
178	""	65188	1738	375	11
179	""	66895	1735	375	12
180	""	68703	1750	375	6
181	""	70339	1727	375	3
182	20	71838	1705	585	30
183	""	73468	1674	585	30
184	""	75153	1662	585	30
185	""	76799	1659	585	30
186	""	78486	1656	585	30
187	25	80226	1646	585	30
188	""	81720	1626	585	30
189	""	83122	1612	585	0
190	""	84648	1597	585	0
191	""	86192	1577	793	30
192	""	87664	1552	793	29
193	""	89078	1513	793	30
194	Aug	90367	1449	793	30
195	""	91593	1410	793	30
196	""	92662	1363	793	29
197	""	93820	1311	1058	68
198	05	94882	1241	1058	38
199	""	95942	1183	1058	38
200	""	105526	2349	1109	45
201	""	109939	2796	1109	45
202	""	109939	2621	1109	45
203	10	111822	2737	1109	45
204	""	113501	2812	1433	54
205	""	115615	2962	1433	53
206	""	117104	3023	1433	54
207	""	118514	1855	1433	46
208	15	119781	1406	1433	46
209	""	119781	1406	1433	47
EOF

# confirmed:
set label "119781 " at first 209,119*400/150   left back textcolor "#8080ff"
# -~confirmed:
set label "1406   " at first 209,140           left back textcolor "#ff8080"
set label "3981   " at first 169,398        +4 left back textcolor "#ff8080"
# deaths:
set label "1433   " at first 209,143*400/150   left back textcolor "#8080ff"
# -~deaths:
set label "47     " at first 209, 47*400/150   left back textcolor "#8080ff"
set label "68     " at first 197, 68*400/150+4 left back textcolor "#8080ff"

set multiplot
  plot $data using 0:($3/   1000*400/150) with lines lc 6 lw 8 dt 1 title at 0.150, 0.920
replot $data using 0:($4/     10        ) with lines lc 7 lw 8 dt 4 title at 0.150, 0.902
replot $data using 0:($5/     10*400/150) with lines lc 6 lw 5 dt 2 title at 0.150, 0.884
replot $data using 0:($6/      1*400/150) with lines lc 6 lw 5 dt 3 title at 0.150, 0.866

# plot hor axis calendar
replot $data using 0:(0):xticlabel(2) with lines
|
File history
Click on a date/time to view the file as it appeared at that time.
| Date/Time | Thumbnail | Dimensions | User | Comment | |
|---|---|---|---|---|---|
| current | 19:15, 24 September 2020 |  | 3,300 × 1,950 (23 KB) | Jochen Burghardt (talk | contribs) | =={{int:filedesc}}== {{Information |description={{en|1=Diagram of WHO COVID-19 daily data (20 Jan - 16 Aug 2020) for ''"Total Confirmed Cases"'' (thick solid line), its smoothed increment (thick dash-dotted line), ''"Total Deaths"'' (thin dashed line), and its smoothed increment (thin dotted line); see File:WHO_Covid_2020_Jan-Aug_daily_C_Afghanistan.pdf for details.}} |date=2020-09-24 |source={{own}} |author=Jochen Burghardt |permission= |other_versions=[[:File:... |
You cannot overwrite this file.
File usage on Commons
There are no pages that use this file.