File:WHO Covid 2020 Jan-Aug daily C Japan.pdf
Jump to navigation
Jump to search

Size of this JPG preview of this PDF file: 800 × 473 pixels. Other resolutions: 320 × 189 pixels | 640 × 378 pixels | 1,024 × 605 pixels | 1,280 × 756 pixels | 3,300 × 1,950 pixels.
Original file (3,300 × 1,950 pixels, file size: 25 KB, MIME type: application/pdf)
Captions
Captions
Add a one-line explanation of what this file represents
Summary[edit]
| Description |
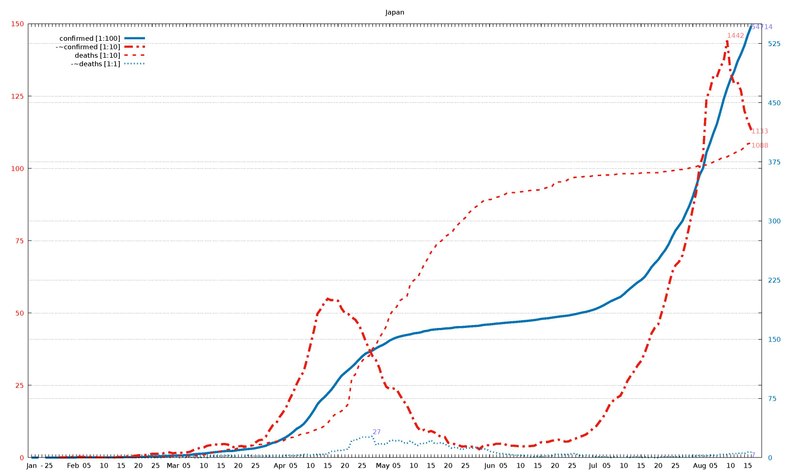
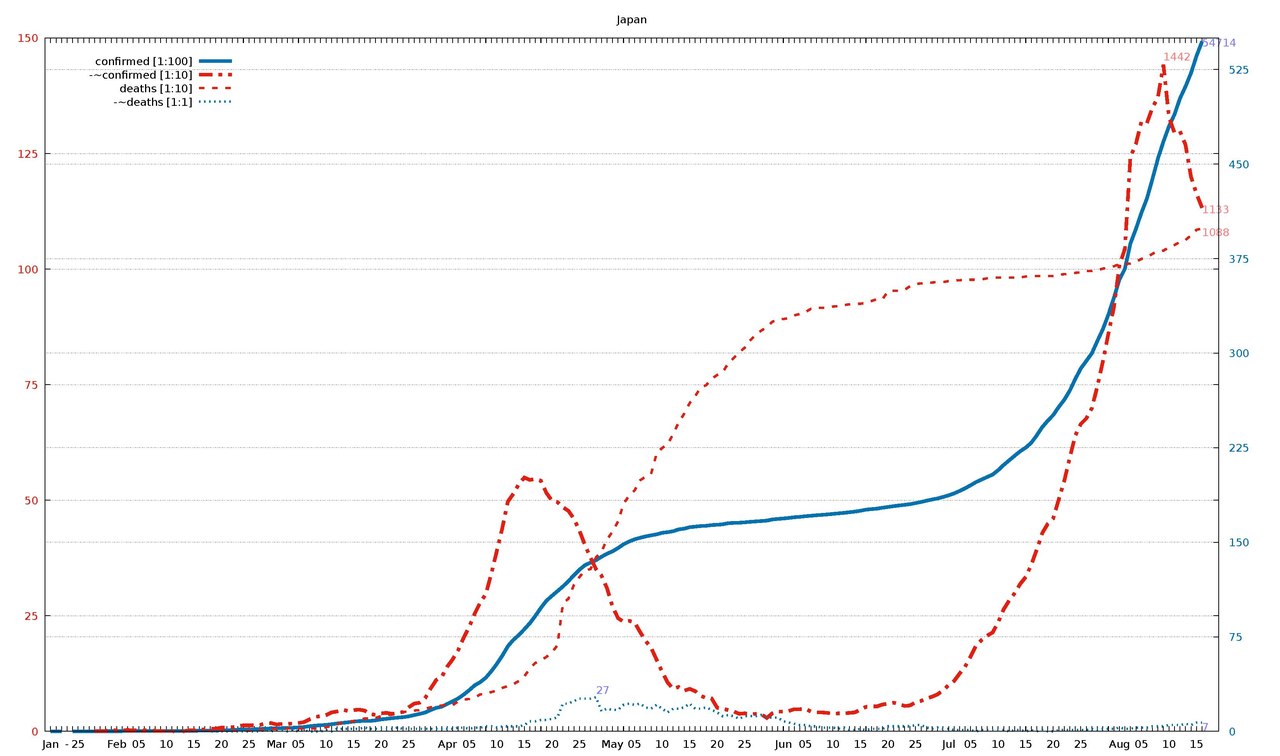
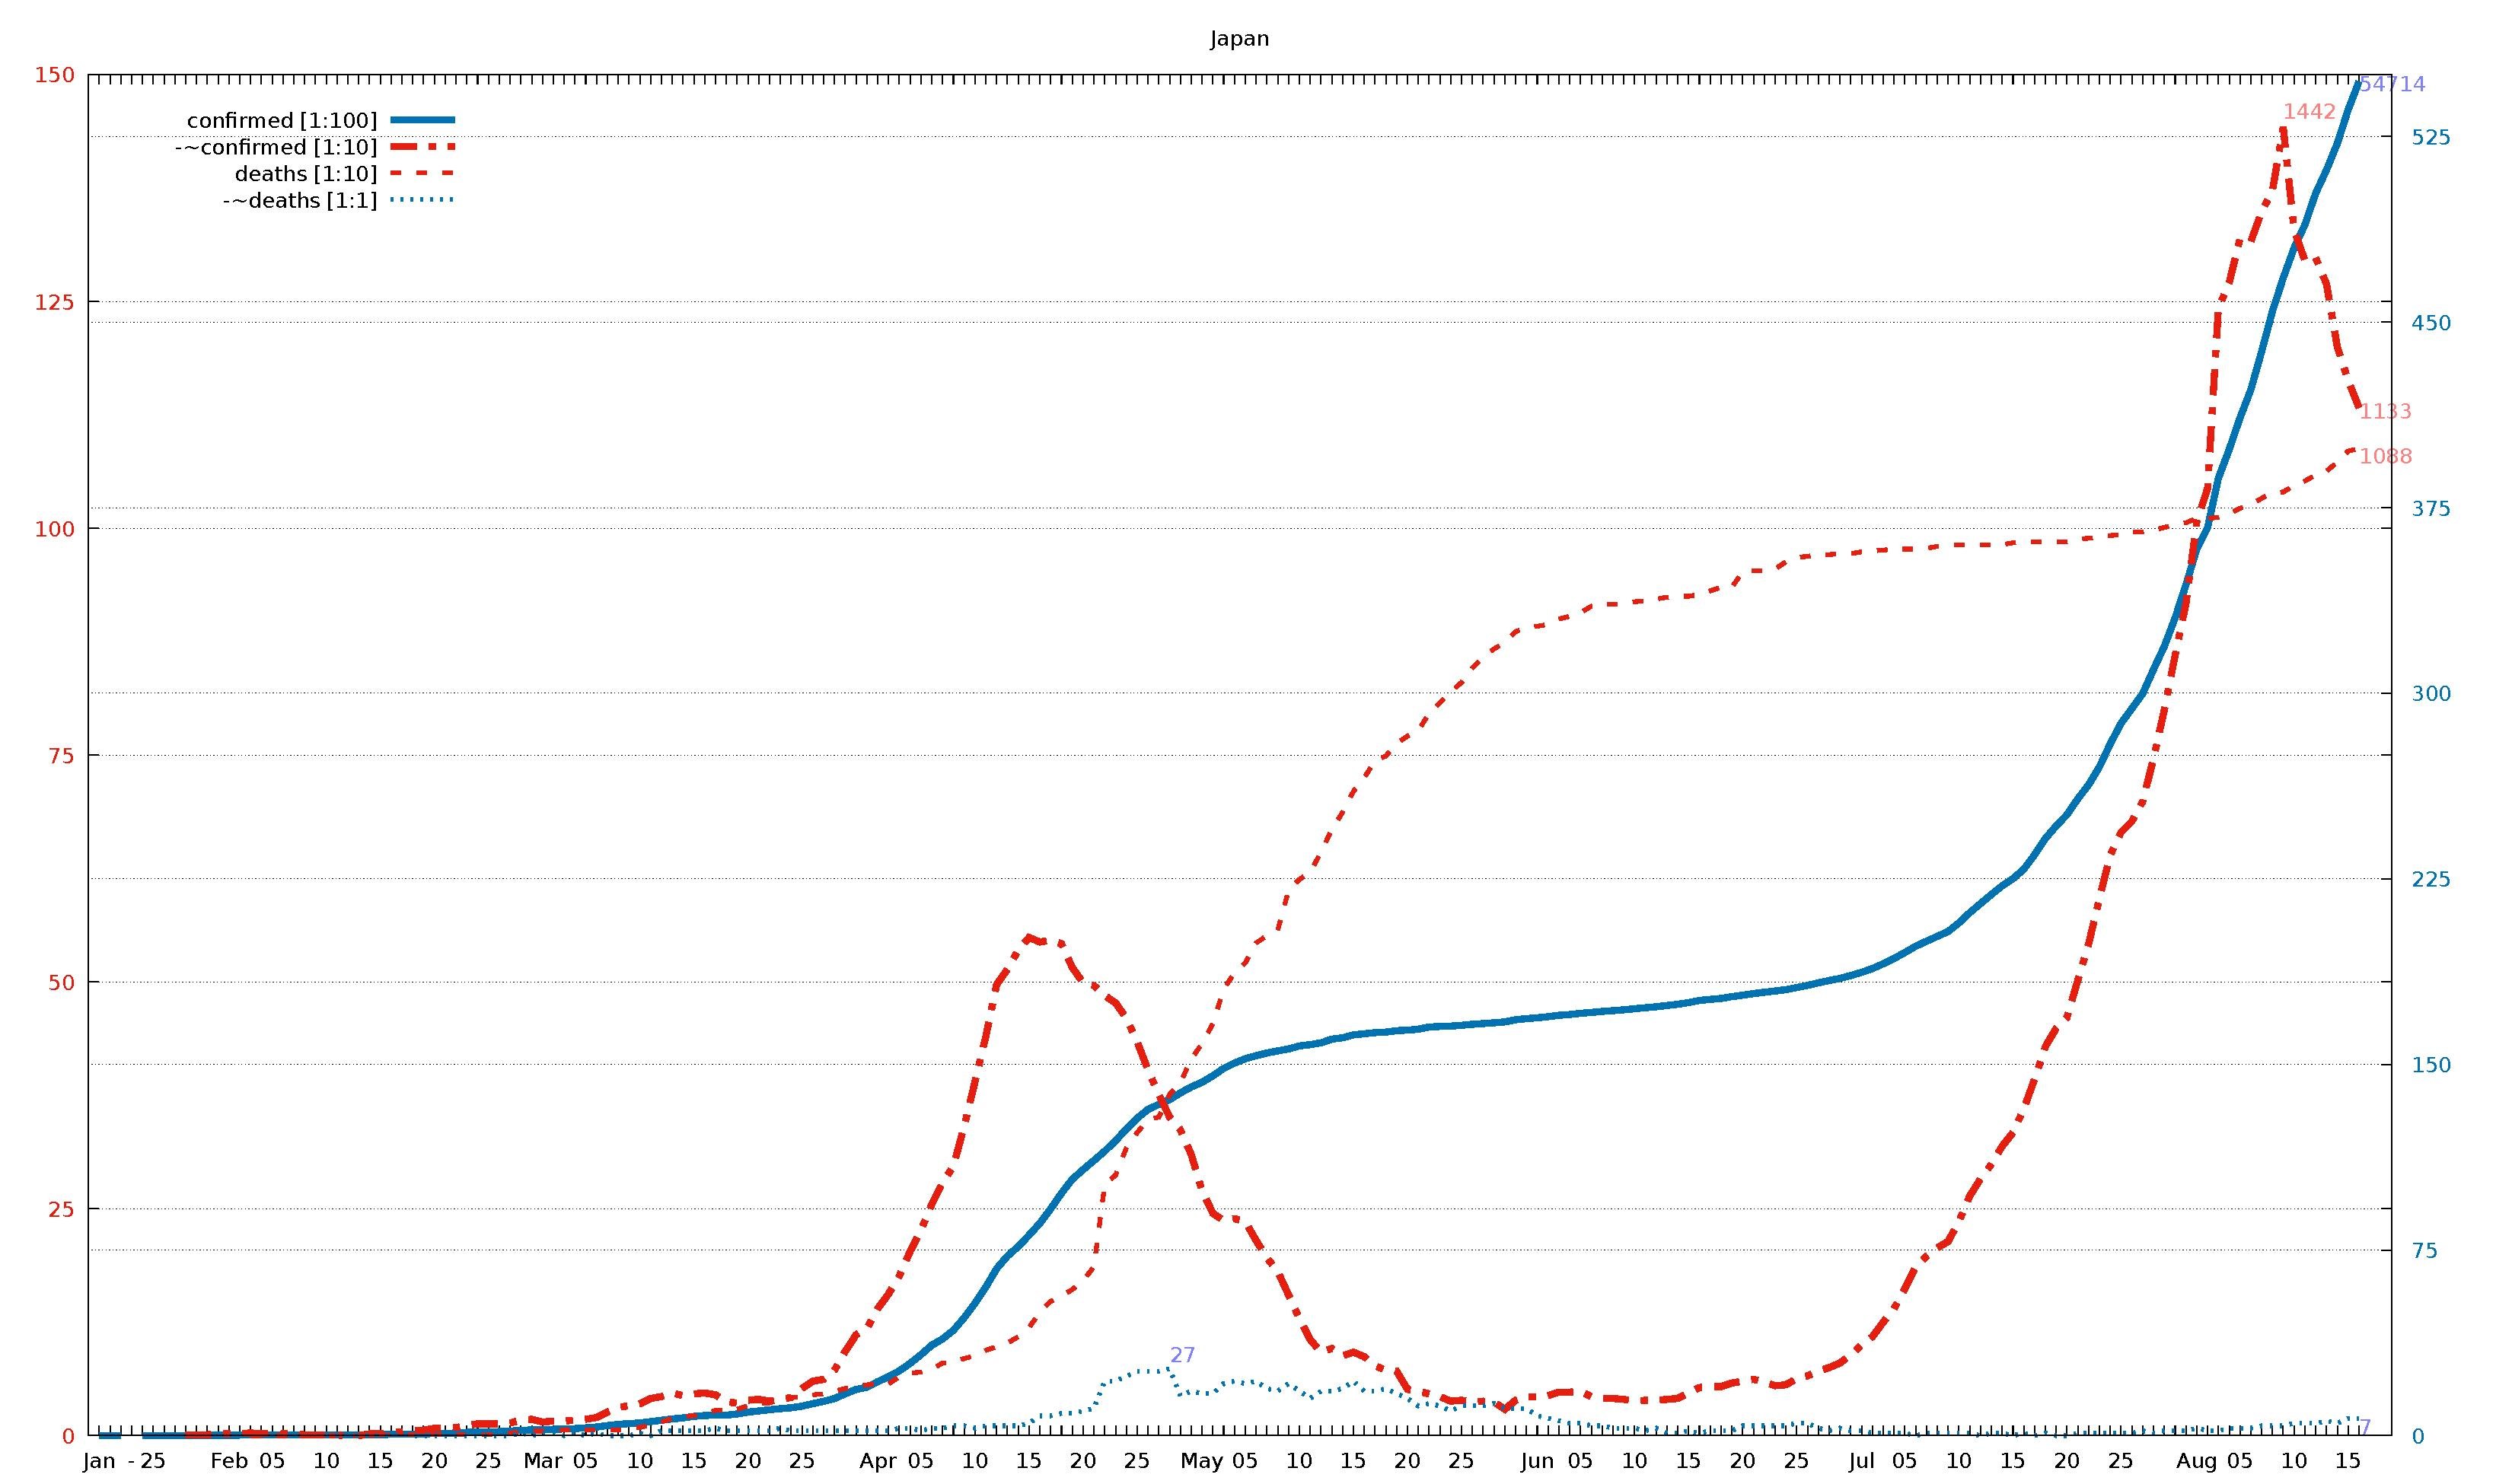
English: Diagram of WHO COVID-19 daily data (20 Jan - 16 Aug 2020) for "Total Confirmed Cases" (thick solid line), its smoothed increment (thick dash-dotted line), "Total Deaths" (thin dashed line) , and its smoothed increment (thin dotted line). Figures are taken from the available situation reports. Red and blue lines refer to the left and right vertical axis, respectively; the scaling factor for each curve is given in the legend. The horizontal axis starts on 20 Jan 2020 (situation report 1), and ends on 16 Aug 2020 (situation report 209). In the smoothed curves, for each day, 1/7 of the difference of the current day's figure and the figure a week ago is shown. For example, in situation report 115 (14 May 2020) and 121 (21 May 2020), there were 8676 and 5339 Total Confirmed Cases in Afghanistan, respectively, so the thick dash-dotted line passes through 477 = (8676-5339)/7 on 21 May.
For an overview of all related visualizations, and a more detailled description, see WHO Covid diagram set#Available country diagrams Jan-Aug 2020 (daily). |
| Date | |
| Source | Own work |
| Author | Jochen Burghardt |
Licensing[edit]
I, the copyright holder of this work, hereby publish it under the following license:
This file is licensed under the Creative Commons Attribution-Share Alike 4.0 International license.
- You are free:
- to share – to copy, distribute and transmit the work
- to remix – to adapt the work
- Under the following conditions:
- attribution – You must give appropriate credit, provide a link to the license, and indicate if changes were made. You may do so in any reasonable manner, but not in any way that suggests the licensor endorses you or your use.
- share alike – If you remix, transform, or build upon the material, you must distribute your contributions under the same or compatible license as the original.
Gnuplot source code[edit]
| Gnuplot source code |
|---|
set term pdf size 22,13
set term pdf font "sans,20"
set output "WHO_Covid_C_Japan.pdf"
set key autotitle columnhead
set termoption noenhanced
# (1) norm: 548 145 109 001
# (2) dist: 1,0:264 2,0:198 2,1:133
# (3,4) dist max: 264 1:145--0:548
# (4) right: 1 0 0 1
# (6,7) scMax: 150 550
# (8) scale: [1:100] [1:10] [1:10] [1:1]


set xrange [-1:212]
set yrange [0:150]
set y2range [0:550]
set xtics 3650,100
set ytics 25 textcolor "#e51e10"
set y2tics 75 textcolor "#0072b2"
set grid y y2

set title "Japan"

$data <<EOF
rep day "confirmed [1:100]" "-~confirmed [1:10]" "deaths [1:10]" "-~deaths [1:1]"
1	Jan	1	-	.	-
2	""	1	-	.	-
3	""	1	-	.	-
-	-	-	-	-	-
4	""	1	-	.	-
5	25	3	-	.	-
6	""	3	-	.	-
7	""	4	-	.	-
8	""	6	1	.	-
9	""	7	1	.	-
10	""	11	1	.	-
11	""	14	2	.	-
12	Feb	17	2	.	-
13	""	20	2	.	-
14	""	20	3	0	-
15	""	20	2	0	-
16	05	33	3	0	-
17	""	25	2	0	-
18	""	25	2	0	-
19	""	25	1	0	-
20	""	26	1	0	-
21	10	26	1	0	0
22	""	26	1	0	0
23	""	28	-1	0	0
24	""	29	0	0	0
25	""	33	2	1	0
26	15	41	2	1	0
27	""	53	4	1	0
28	""	59	4	1	1
29	""	65	6	1	0
30	""	73	6	1	0
31	20	85	8	1	0
32	""	93	9	1	0
33	""	105	9	1	0
34	""	132	11	1	0
35	""	144	13	1	0
36	25	157	13	1	0
37	""	164	13	1	0
38	""	186	14	3	0
39	""	210	17	4	1
40	""	230	18	5	0
41	Mar	239	15	5	1
42	""	254	16	6	1
43	""	268	16	6	0
44	""	284	17	6	1
45	05	317	18	6	0
46	""	349	20	6	1
47	""	408	26	6	0
48	""	455	31	6	0
49	""	488	33	7	0
50	10	514	35	9	1
51	""	568	41	12	0
52	""	620	43	15	2
53	""	675	47	19	2
54	""	716	44	21	2
55	15	780	46	22	2
56	""	814	47	24	2
57	""	829	45	28	3
58	""	829	37	28	2
59	""	873	36	29	2
60	20	950	39	33	2
61	""	996	40	35	2
62	""	1046	38	36	2
63	""	1089	40	41	3
64	""	1128	42	42	2
65	25	1193	52	43	2
66	""	1291	60	45	2
67	""	1387	62	46	2
68	""	1499	72	49	2
69	""	1693	93	52	2
70	""	1866	111	54	2
71	""	1953	118	56	2
72	Apr	2178	140	57	2
73	""	2384	156	57	2
74	""	2617	176	65	3
75	""	2920	203	69	3
76	05	3271	226	70	2
77	""	3654	255	73	3
78	""	3906	279	80	3
79	""	4257	297	81	4
80	""	4768	341	85	4
81	10	5347	390	88	3
82	""	6005	440	94	4
83	""	6748	497	98	4
84	""	7255	514	102	4
85	""	7645	535	109	4
86	15	8100	549	119	5
87	""	8582	544	136	8
88	""	9167	546	148	8
89	""	9795	542	154	9
90	""	10361	516	161	9
91	20	10751	499	171	10
92	""	11118	496	186	11
93	""	11496	485	277	22
94	""	11919	477	287	22
95	""	12388	460	317	24
96	25	12829	434	334	26
97	""	13182	403	348	26
98	""	13385	376	351	26
99	""	13576	351	376	27
100	""	13852	337	389	16
101	""	14088	310	415	18
102	May	14281	270	432	17
103	""	14545	245	454	17
104	""	14839	237	492	21
105	""	15057	239	510	22
106	05	15231	236	521	21
107	""	15354	215	543	22
108	""	15463	196	551	19
109	""	15547	181	557	18
110	""	15628	155	601	21
111	10	15747	129	613	18
112	""	15798	106	621	15
113	""	15874	92	643	18
114	""	16024	96	668	18
115	""	16079	88	687	19
116	15	16193	92	710	22
117	""	16237	87	725	18
118	""	16285	77	744	18
119	""	16305	72	749	19
120	""	16365	71	763	17
121	20	16385	51	771	15
122	""	16424	49	777	12
123	""	16513	46	796	13
124	""	16536	43	808	12
125	""	16550	38	820	10
126	25	16581	39	830	12
127	""	16623	37	846	12
128	""	16651	38	858	12
129	""	16683	37	867	13
130	""	16719	29	874	11
131	""	16804	39	886	11
132	""	16851	43	891	11
133	Jun	16884	43	892	8
134	""	16930	44	894	7
135	""	16986	48	900	6
136	""	17018	48	903	5
137	05	17064	49	907	5
138	""	17103	43	914	4
139	""	17141	41	916	4
140	""	17174	41	916	3
141	""	17210	40	916	3
142	10	17251	38	919	3
143	""	17292	39	920	2
144	""	17332	39	922	3
145	""	17382	40	924	1
146	""	17429	41	925	1
147	15	17502	47	925	2
148	""	17587	53	927	1
149	""	17628	54	931	2
150	""	17668	54	935	2
151	""	17740	58	935	2
152	20	17799	60	952	4
153	""	17864	62	953	4
154	""	17916	59	953	4
155	""	17968	55	955	4
156	""	18024	56	963	4
157	25	18110	63	968	5
158	""	18197	66	969	5
159	""	18297	71	971	3
160	""	18390	75	971	2
161	""	18476	80	972	3
162	""	18593	89	972	2
163	Jul	18723	100	974	2
164	""	18874	109	975	1
165	""	19068	125	976	1
166	""	19282	140	977	1
167	05	19522	162	977	1
168	""	19775	186	977	0
169	""	19981	198	978	1
170	""	20174	207	980	1
171	""	20371	214	981	1
172	10	20719	236	982	1
173	""	21129	264	982	1
174	""	21502	283	982	0
175	""	21868	299	982	1
176	""	22220	319	982	1
177	15	22508	334	984	0
178	""	22890	360	985	1
179	""	23473	393	985	0
180	""	24132	429	985	1
181	""	24642	449	985	0
182	20	25096	461	985	0
183	""	25736	502	988	1
184	""	26303	542	989	1
185	""	27029	592	990	1
186	""	27956	640	992	1
187	25	28786	665	993	1
188	""	29382	677	996	1
189	""	29989	699	996	2
190	""	30961	746	998	1
191	""	31901	800	1001	2
192	""	33049	860	1004	2
193	""	34372	917	1006	2
194	Aug	35836	1007	1011	3
195	""	36689	1044	1011	2
196	""	38687	1242	1012	2
197	""	39858	1271	1016	3
198	05	41129	1319	1022	3
199	""	42263	1316	1026	3
200	""	43815	1349	1033	4
201	""	45439	1372	1039	4
202	""	46782	1442	1040	4
203	10	47990	1329	1047	5
204	""	48928	1295	1052	5
205	""	50210	1298	1059	5
206	""	51147	1269	1063	6
207	""	52217	1200	1073	5
208	15	53577	1163	1085	7
209	""	54714	1133	1088	7
EOF

# confirmed:
set label "54714  " at first 209,547*150/550   left back textcolor "#8080ff"
# -~confirmed:
set label "1133   " at first 209,113           left back textcolor "#ff8080"
set label "1442   " at first 202,144        +2 left back textcolor "#ff8080"
# deaths:
set label "1088   " at first 209,108           left back textcolor "#ff8080"
# -~deaths:
set label "7      " at first 209,  7*150/550   left back textcolor "#8080ff"
set label "27     " at first  99, 27*150/550+2 left back textcolor "#8080ff"

set multiplot
  plot $data using 0:($3/    100*150/550) with lines lc 6 lw 8 dt 1 title at 0.150, 0.920
replot $data using 0:($4/     10        ) with lines lc 7 lw 8 dt 4 title at 0.150, 0.902
replot $data using 0:($5/     10        ) with lines lc 7 lw 5 dt 2 title at 0.150, 0.884
replot $data using 0:($6/      1*150/550) with lines lc 6 lw 5 dt 3 title at 0.150, 0.866

# plot hor axis calendar
replot $data using 0:(0):xticlabel(2) with lines
|
File history
Click on a date/time to view the file as it appeared at that time.
| Date/Time | Thumbnail | Dimensions | User | Comment | |
|---|---|---|---|---|---|
| current | 19:14, 24 September 2020 |  | 3,300 × 1,950 (25 KB) | Jochen Burghardt (talk | contribs) | =={{int:filedesc}}== {{Information |description={{en|1=Diagram of WHO COVID-19 daily data (20 Jan - 16 Aug 2020) for ''"Total Confirmed Cases"'' (thick solid line), its smoothed increment (thick dash-dotted line), ''"Total Deaths"'' (thin dashed line), and its smoothed increment (thin dotted line); see File:WHO_Covid_2020_Jan-Aug_daily_C_Afghanistan.pdf for details.}} |date=2020-09-24 |source={{own}} |author=Jochen Burghardt |permission= |other_versions=[[:File:... |
You cannot overwrite this file.
File usage on Commons
There are no pages that use this file.