File:WHO Covid 2020 Jan-Aug daily C Honduras.pdf
Jump to navigation
Jump to search

Size of this JPG preview of this PDF file: 800 × 473 pixels. Other resolutions: 320 × 189 pixels | 640 × 378 pixels | 1,024 × 605 pixels | 1,280 × 756 pixels | 3,300 × 1,950 pixels.
Original file (3,300 × 1,950 pixels, file size: 24 KB, MIME type: application/pdf)
Captions
Captions
Add a one-line explanation of what this file represents
Summary[edit]
| Description |
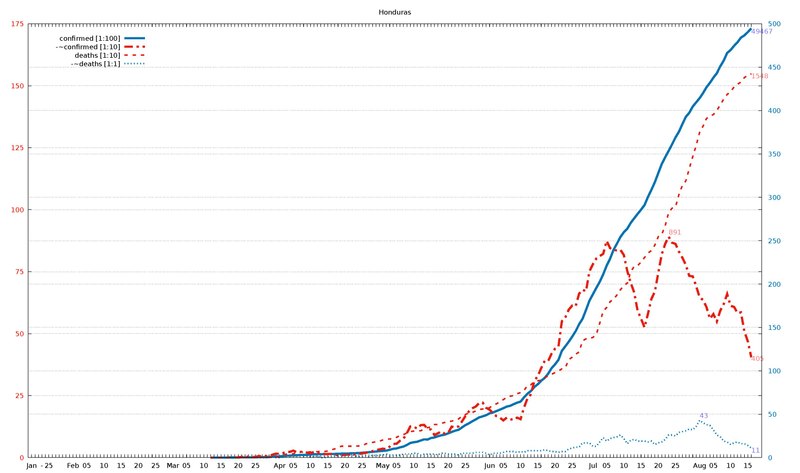
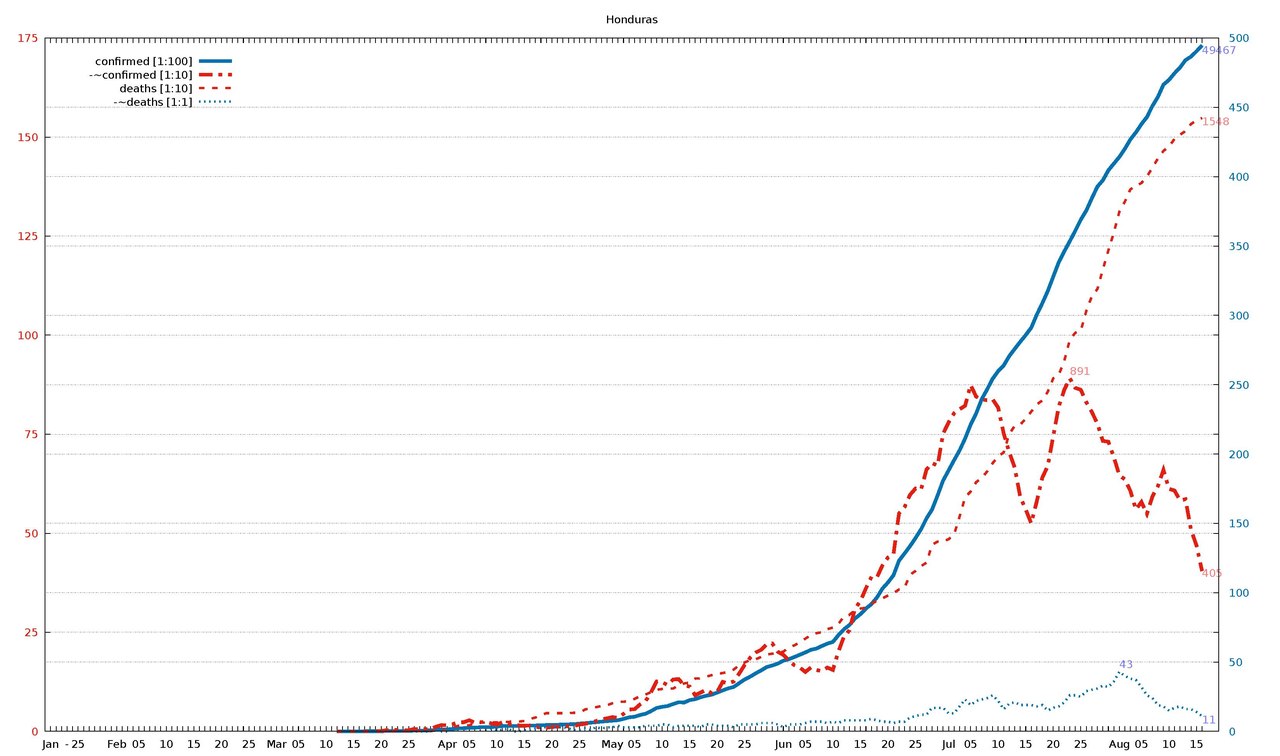
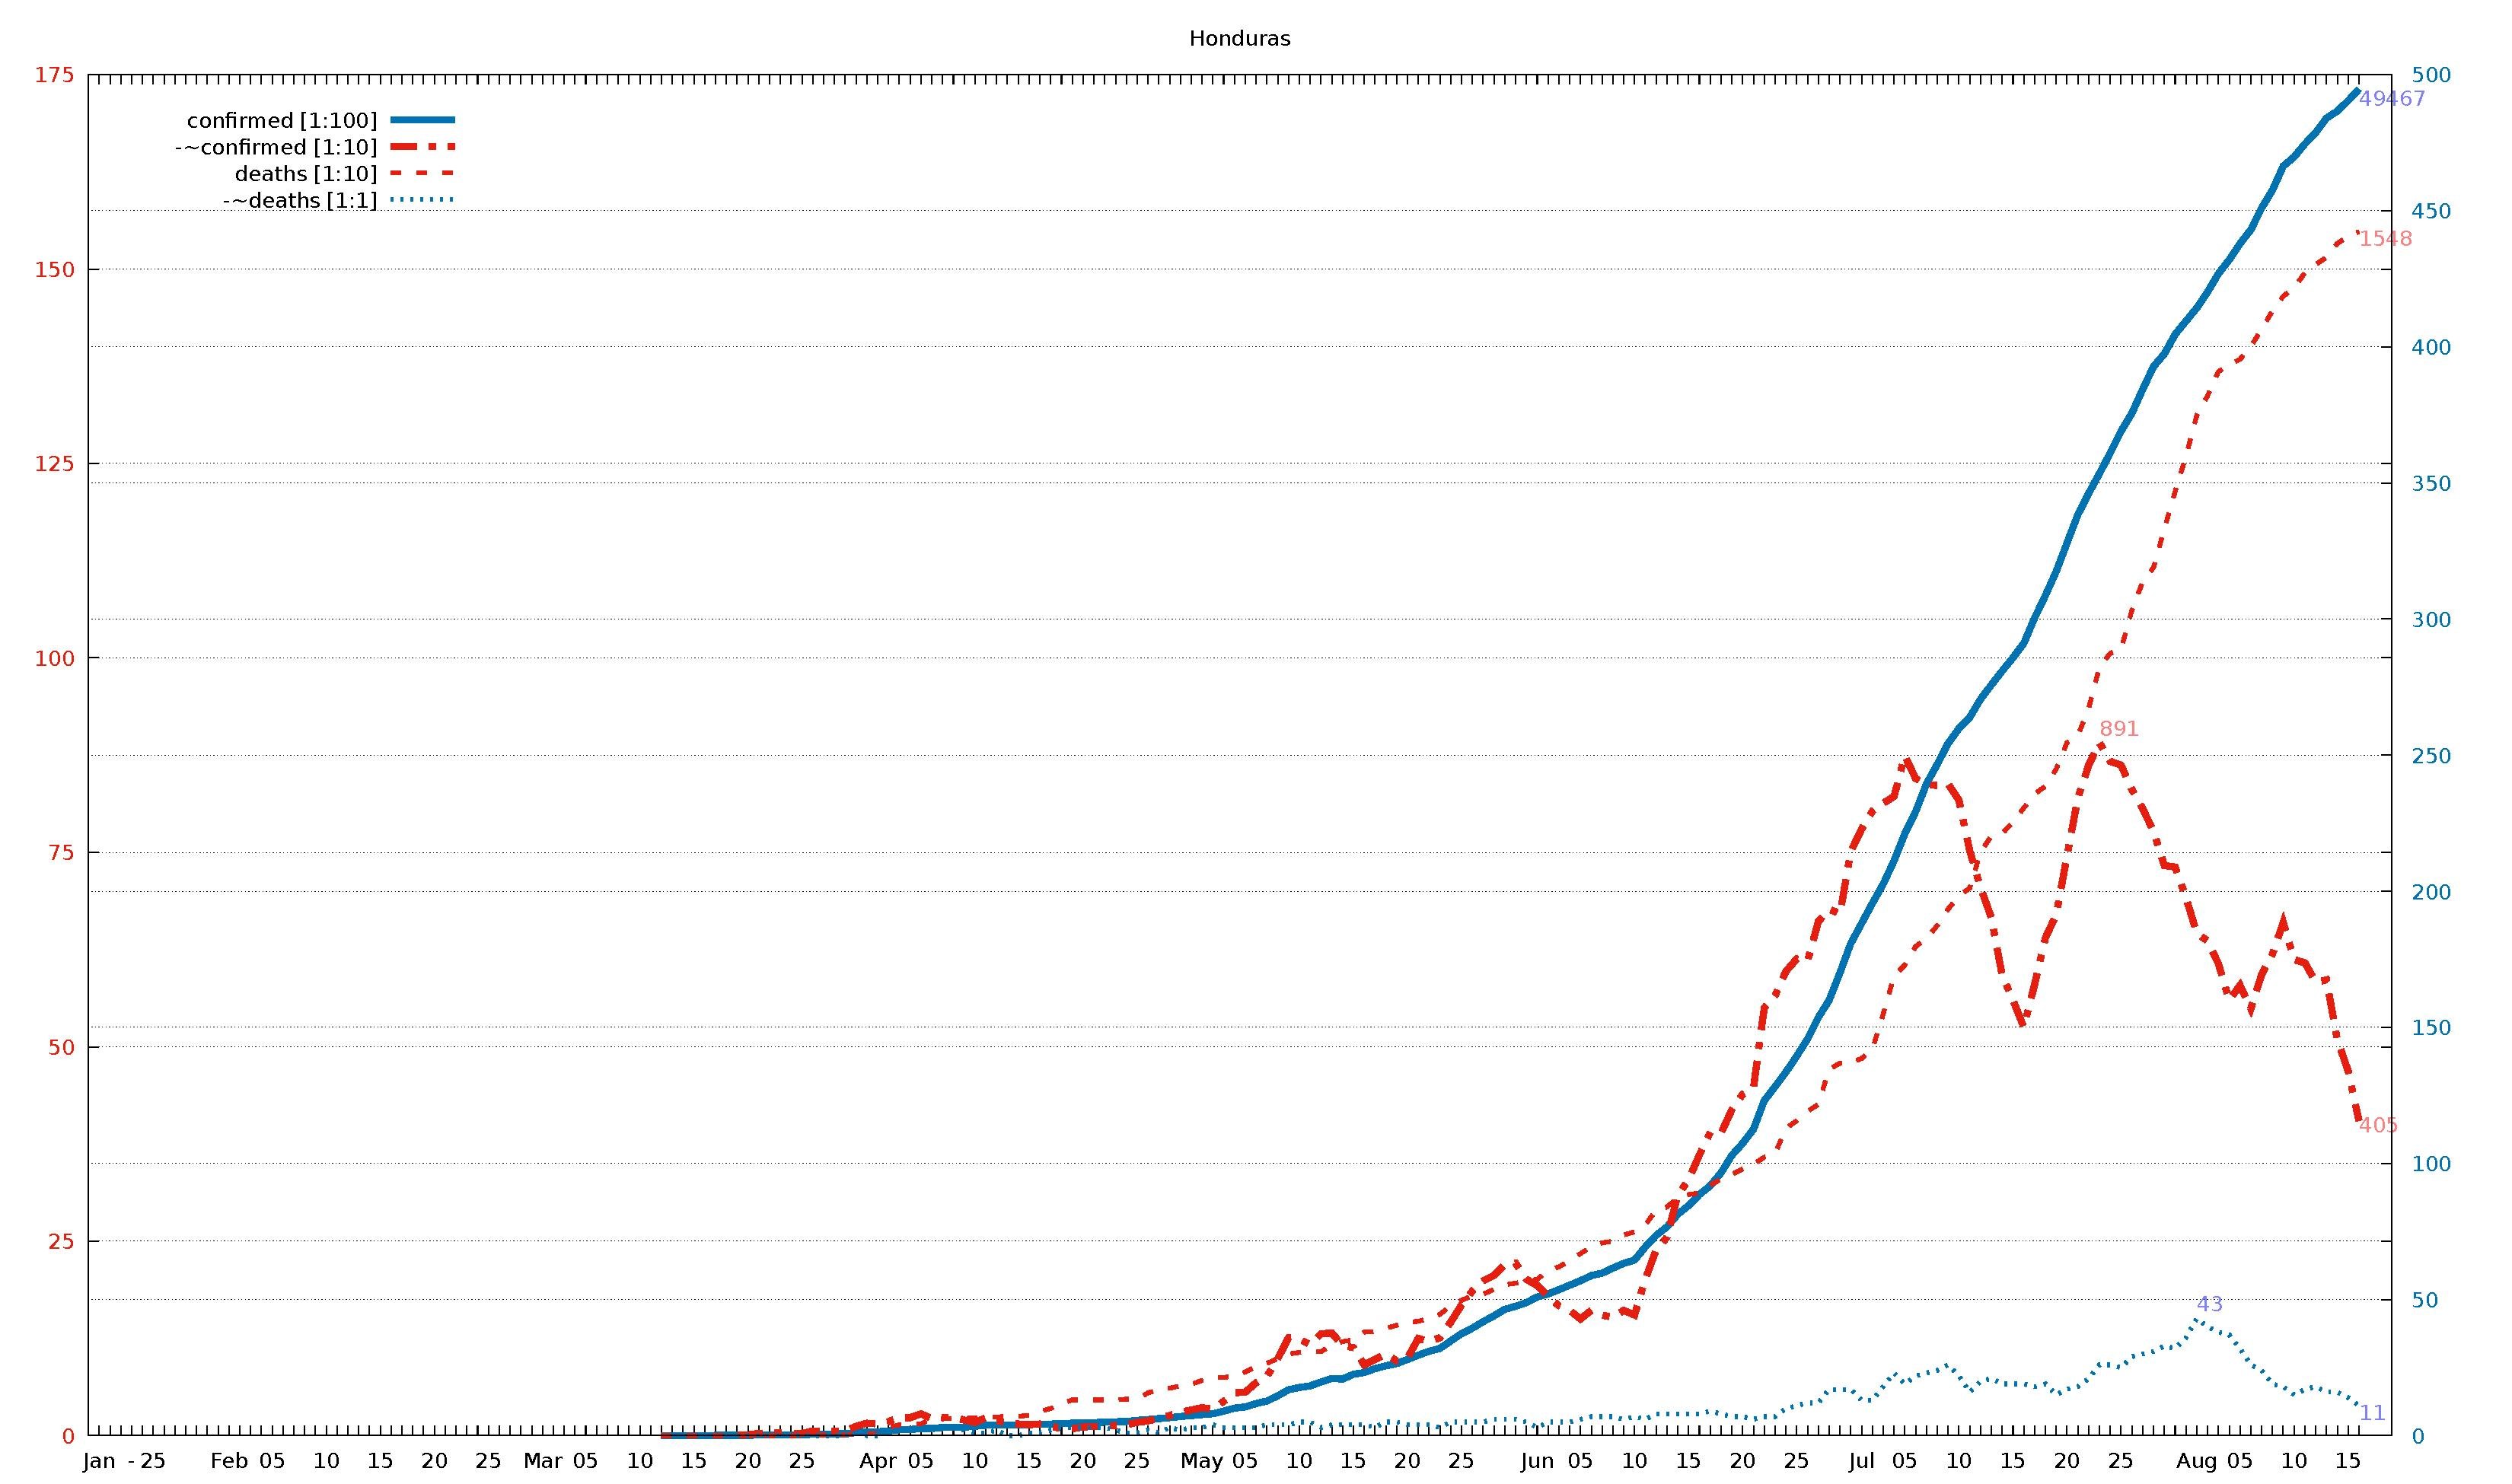
English: Diagram of WHO COVID-19 daily data (20 Jan - 16 Aug 2020) for "Total Confirmed Cases" (thick solid line), its smoothed increment (thick dash-dotted line), "Total Deaths" (thin dashed line) , and its smoothed increment (thin dotted line). Figures are taken from the available situation reports. Red and blue lines refer to the left and right vertical axis, respectively; the scaling factor for each curve is given in the legend. The horizontal axis starts on 20 Jan 2020 (situation report 1), and ends on 16 Aug 2020 (situation report 209). In the smoothed curves, for each day, 1/7 of the difference of the current day's figure and the figure a week ago is shown. For example, in situation report 115 (14 May 2020) and 121 (21 May 2020), there were 8676 and 5339 Total Confirmed Cases in Afghanistan, respectively, so the thick dash-dotted line passes through 477 = (8676-5339)/7 on 21 May.
For an overview of all related visualizations, and a more detailled description, see WHO Covid diagram set#Available country diagrams Jan-Aug 2020 (daily). |
| Date | |
| Source | Own work |
| Author | Jochen Burghardt |
Licensing[edit]
I, the copyright holder of this work, hereby publish it under the following license:
This file is licensed under the Creative Commons Attribution-Share Alike 4.0 International license.
- You are free:
- to share – to copy, distribute and transmit the work
- to remix – to adapt the work
- Under the following conditions:
- attribution – You must give appropriate credit, provide a link to the license, and indicate if changes were made. You may do so in any reasonable manner, but not in any way that suggests the licensor endorses you or your use.
- share alike – If you remix, transform, or build upon the material, you must distribute your contributions under the same or compatible license as the original.
Gnuplot source code[edit]
| Gnuplot source code |
|---|
set term pdf size 22,13
set term pdf font "sans,20"
set output "WHO_Covid_C_Honduras.pdf"
set key autotitle columnhead
set termoption noenhanced
# (1) norm: 495 891 155 001
# (2) dist: 1,0:180 2,0:313 2,1:173
# (3,4) dist max: 313 2:155--0:495
# (4) right: 1 0 0 1
# (6,7) scMax: 175 500
# (8) scale: [1:100] [1:10] [1:10] [1:1]


set xrange [-1:212]
set yrange [0:175]
set y2range [0:500]
set xtics 3650,100
set ytics 25 textcolor "#e51e10"
set y2tics 50 textcolor "#0072b2"
set grid y y2

set title "Honduras"

$data <<EOF
rep day "confirmed [1:100]" "-~confirmed [1:10]" "deaths [1:10]" "-~deaths [1:1]"
1	Jan	.	-	.	-
2	""	.	-	.	-
3	""	.	-	.	-
-	-	-	-	-	-
4	""	.	-	.	-
5	25	.	-	.	-
6	""	.	-	.	-
7	""	.	-	.	-
8	""	.	-	.	-
9	""	.	-	.	-
10	""	.	-	.	-
11	""	.	-	.	-
12	Feb	.	-	.	-
13	""	.	-	.	-
14	""	.	-	.	-
15	""	.	-	.	-
16	05	.	-	.	-
17	""	.	-	.	-
18	""	.	-	.	-
19	""	.	-	.	-
20	""	.	-	.	-
21	10	.	-	.	-
22	""	.	-	.	-
23	""	.	-	.	-
24	""	.	-	.	-
25	""	.	-	.	-
26	15	.	-	.	-
27	""	.	-	.	-
28	""	.	-	.	-
29	""	.	-	.	-
30	""	.	-	.	-
31	20	.	-	.	-
32	""	.	-	.	-
33	""	.	-	.	-
34	""	.	-	.	-
35	""	.	-	.	-
36	25	.	-	.	-
37	""	.	-	.	-
38	""	.	-	.	-
39	""	.	-	.	-
40	""	.	-	.	-
41	Mar	.	-	.	-
42	""	.	-	.	-
43	""	.	-	.	-
44	""	.	-	.	-
45	05	.	-	.	-
46	""	.	-	.	-
47	""	.	-	.	-
48	""	.	-	.	-
49	""	.	-	.	-
50	10	.	-	.	-
51	""	.	-	.	-
52	""	2	-	0	-
53	""	2	-	0	-
54	""	2	-	0	-
55	15	2	-	0	-
56	""	2	-	0	-
57	""	8	-	0	-
58	""	8	-	0	-
59	""	9	1	0	0
60	20	12	1	0	0
61	""	24	3	0	0
62	""	24	3	0	0
63	""	26	4	0	0
64	""	30	3	0	0
65	25	30	3	0	0
66	""	52	6	0	0
67	""	52	6	1	0
68	""	67	6	1	0
69	""	67	6	1	0
70	""	110	12	2	1
71	""	139	16	2	0
72	Apr	139	15	2	0
73	""	172	18	10	2
74	""	219	23	14	2
75	""	222	23	15	2
76	05	264	28	15	2
77	""	268	22	22	2
78	""	298	23	22	3
79	""	305	24	22	3
80	""	312	20	22	2
81	10	343	17	23	1
82	""	382	23	23	1
83	""	392	19	24	2
84	""	393	17	25	0
85	""	397	15	25	0
86	15	407	14	26	1
87	""	419	15	31	1
88	""	426	12	35	2
89	""	442	9	41	3
90	""	457	9	46	3
91	20	472	11	46	3
92	""	477	12	46	3
93	""	494	12	46	3
94	""	510	13	46	2
95	""	519	14	47	1
96	25	562	17	47	1
97	""	591	19	55	2
98	""	627	22	59	1
99	""	661	26	61	3
100	""	702	30	64	2
101	""	738	33	66	3
102	May	771	36	71	3
103	""	804	34	75	4
104	""	899	44	75	3
105	""	1010	55	76	3
106	05	1055	56	82	3
107	""	1178	68	89	3
108	""	1270	76	93	4
109	""	1461	99	99	4
110	""	1685	126	105	4
111	10	1771	124	107	5
112	""	1830	117	108	5
113	""	1972	131	108	3
114	""	2100	132	116	4
115	""	2080	116	121	4
116	15	2255	113	123	4
117	""	2318	91	133	4
118	""	2460	98	134	3
119	""	2565	105	138	5
120	""	2646	96	142	5
121	20	2798	100	146	4
122	""	2955	125	147	4
123	""	3100	121	151	4
124	""	3204	126	156	3
125	""	3477	146	167	5
126	25	3743	168	174	5
127	""	3950	186	180	5
128	""	4189	199	182	5
129	""	4401	206	188	6
130	""	4640	220	194	6
131	""	4752	222	196	6
132	""	4886	201	199	5
133	Jun	5094	193	201	3
134	""	5202	179	212	5
135	""	5362	167	217	5
136	""	5527	161	225	5
137	05	5690	150	234	6
138	""	5880	161	243	7
139	""	5971	155	248	7
140	""	6155	152	250	7
141	""	6327	161	258	6
142	10	6450	155	262	7
143	""	6935	201	271	6
144	""	7360	239	290	8
145	""	7669	255	294	8
146	""	8132	309	306	8
147	15	8455	329	310	8
148	""	8858	361	312	8
149	""	9178	390	322	9
150	""	9656	389	330	8
151	""	10299	419	336	7
152	20	10739	439	343	7
153	""	11258	447	349	6
154	""	12306	550	358	7
155	""	12825	566	363	7
156	""	13356	597	395	10
157	25	13943	613	405	11
158	""	14571	610	417	12
159	""	15366	661	426	12
160	""	15994	677	471	17
161	""	17007	671	479	17
162	""	18082	751	479	17
163	Jul	18818	780	485	13
164	""	19558	803	497	13
165	""	20262	813	542	18
166	""	21120	822	591	23
167	05	22116	874	605	19
168	""	22921	845	629	22
169	""	23943	837	639	23
170	""	24665	836	656	24
171	""	25428	838	677	26
172	10	25978	817	694	22
173	""	26384	752	704	16
174	""	27053	705	750	20
175	""	27583	666	771	21
176	""	28090	592	774	19
177	15	28579	560	789	19
178	""	29106	525	807	19
179	""	30036	580	825	18
180	""	30867	640	835	19
181	""	31745	670	857	15
182	20	32793	745	891	17
183	""	33835	820	900	18
184	""	34611	862	935	21
185	""	35345	891	988	26
186	""	36102	867	1006	26
187	25	36902	862	1011	25
188	""	37559	831	1061	29
189	""	38438	806	1098	30
190	""	39276	777	1116	31
191	""	39741	733	1166	33
192	""	40460	731	1214	32
193	""	40944	692	1259	36
194	Aug	41426	646	1312	43
195	""	42014	636	1337	40
196	""	42685	607	1368	38
197	""	43197	560	1377	37
198	05	43794	579	1384	32
199	""	44299	549	1400	26
200	""	45098	593	1423	24
201	""	45755	619	1446	19
202	""	46635	660	1465	18
203	10	46973	612	1476	15
204	""	47454	608	1495	17
205	""	47872	583	1506	18
206	""	48403	586	1515	16
207	""	48657	509	1533	16
208	15	49042	469	1542	14
209	""	49467	405	1548	11
EOF

# confirmed:
set label "49467  " at first 209,494*175/500   left back textcolor "#8080ff"
# -~confirmed:
set label "405    " at first 209, 40           left back textcolor "#ff8080"
set label "891    " at first 185, 89        +2 left back textcolor "#ff8080"
# deaths:
set label "1548   " at first 209,154           left back textcolor "#ff8080"
# -~deaths:
set label "11     " at first 209, 11*175/500   left back textcolor "#8080ff"
set label "43     " at first 194, 43*175/500+2 left back textcolor "#8080ff"

set multiplot
  plot $data using 0:($3/    100*175/500) with lines lc 6 lw 8 dt 1 title at 0.150, 0.920
replot $data using 0:($4/     10        ) with lines lc 7 lw 8 dt 4 title at 0.150, 0.902
replot $data using 0:($5/     10        ) with lines lc 7 lw 5 dt 2 title at 0.150, 0.884
replot $data using 0:($6/      1*175/500) with lines lc 6 lw 5 dt 3 title at 0.150, 0.866

# plot hor axis calendar
replot $data using 0:(0):xticlabel(2) with lines
|
File history
Click on a date/time to view the file as it appeared at that time.
| Date/Time | Thumbnail | Dimensions | User | Comment | |
|---|---|---|---|---|---|
| current | 19:11, 24 September 2020 |  | 3,300 × 1,950 (24 KB) | Jochen Burghardt (talk | contribs) | =={{int:filedesc}}== {{Information |description={{en|1=Diagram of WHO COVID-19 daily data (20 Jan - 16 Aug 2020) for ''"Total Confirmed Cases"'' (thick solid line), its smoothed increment (thick dash-dotted line), ''"Total Deaths"'' (thin dashed line), and its smoothed increment (thin dotted line); see File:WHO_Covid_2020_Jan-Aug_daily_C_Afghanistan.pdf for details.}} |date=2020-09-24 |source={{own}} |author=Jochen Burghardt |permission= |other_versions=[[:File:... |
You cannot overwrite this file.
File usage on Commons
There are no pages that use this file.