File:WHO Covid 2020 Jan-Aug daily C Guatemala.pdf
Jump to navigation
Jump to search

Size of this JPG preview of this PDF file: 800 × 473 pixels. Other resolutions: 320 × 189 pixels | 640 × 378 pixels | 1,024 × 605 pixels | 1,280 × 756 pixels | 3,300 × 1,950 pixels.
Original file (3,300 × 1,950 pixels, file size: 23 KB, MIME type: application/pdf)
Captions
Captions
Add a one-line explanation of what this file represents
Summary[edit]
| Description |
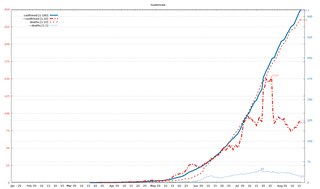
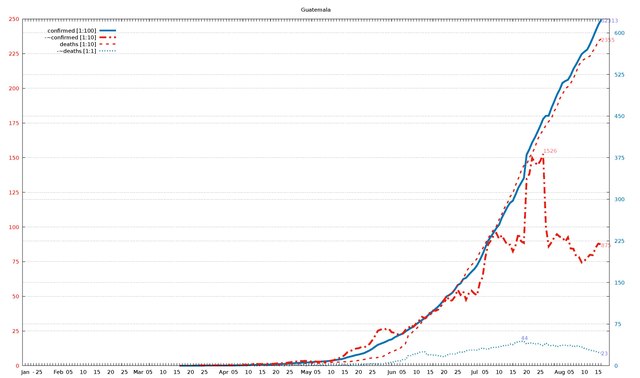
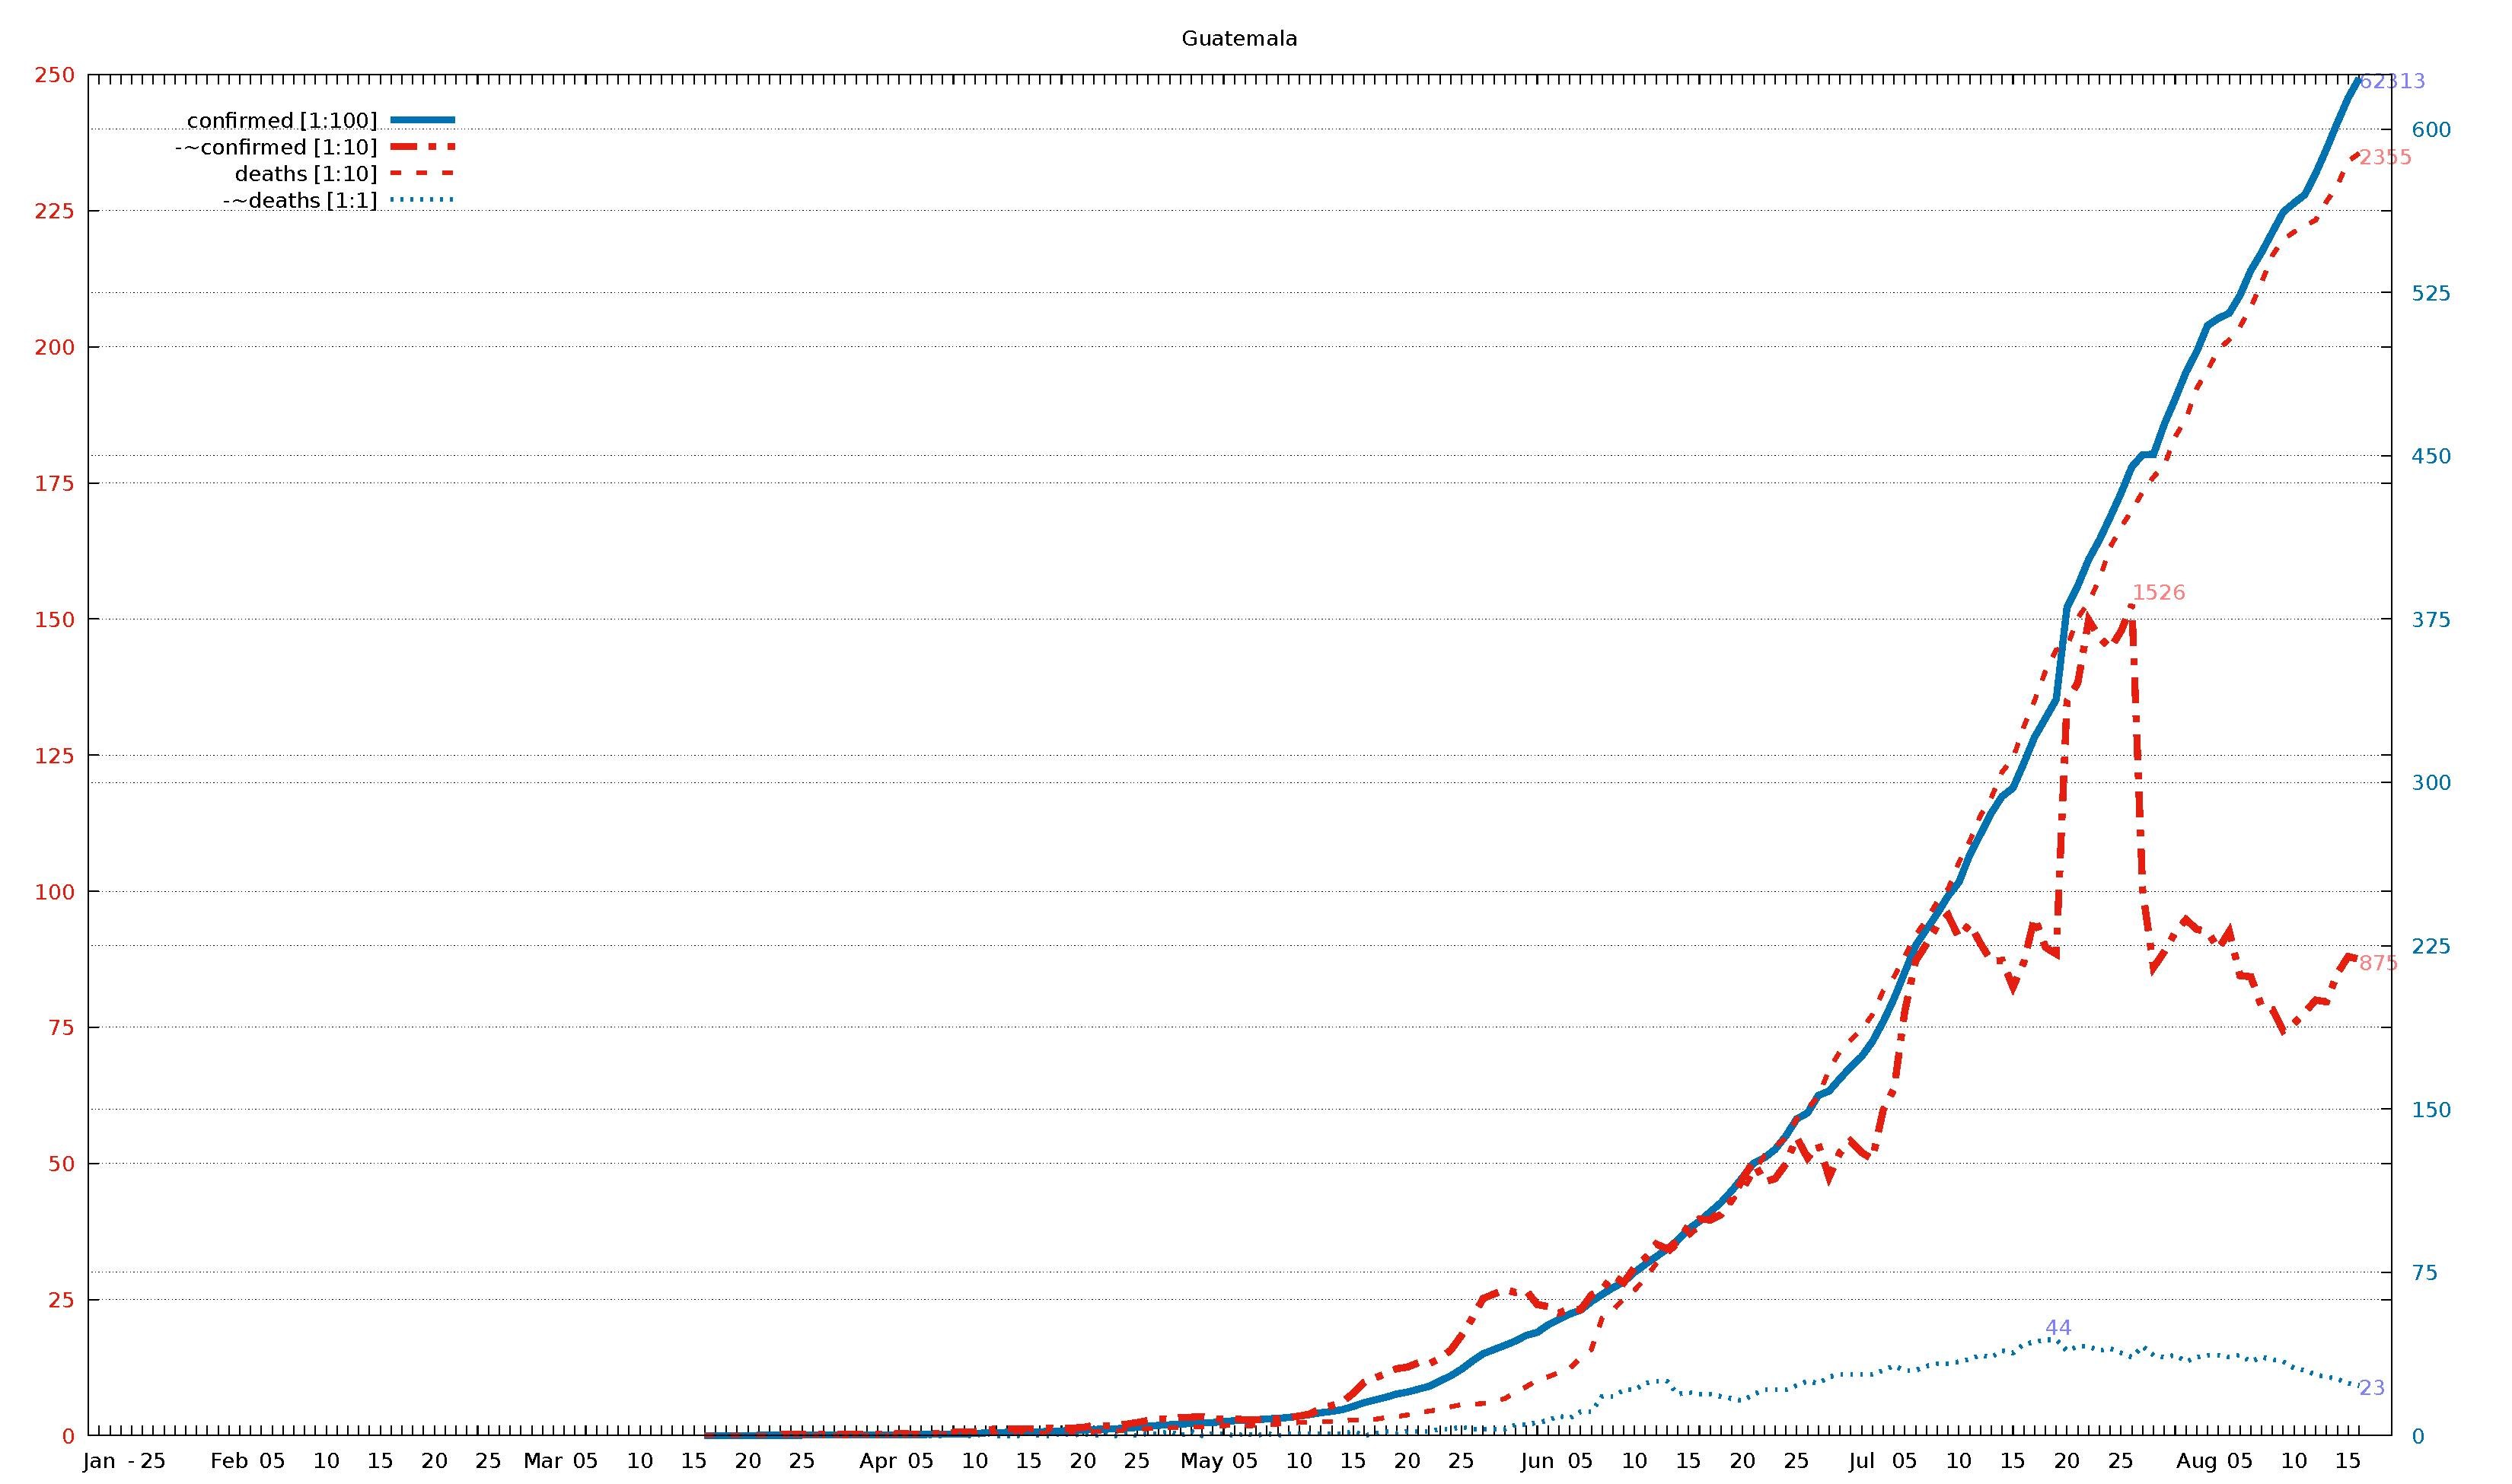
English: Diagram of WHO COVID-19 daily data (20 Jan - 16 Aug 2020) for "Total Confirmed Cases" (thick solid line), its smoothed increment (thick dash-dotted line), "Total Deaths" (thin dashed line) , and its smoothed increment (thin dotted line). Figures are taken from the available situation reports. Red and blue lines refer to the left and right vertical axis, respectively; the scaling factor for each curve is given in the legend. The horizontal axis starts on 20 Jan 2020 (situation report 1), and ends on 16 Aug 2020 (situation report 209). In the smoothed curves, for each day, 1/7 of the difference of the current day's figure and the figure a week ago is shown. For example, in situation report 115 (14 May 2020) and 121 (21 May 2020), there were 8676 and 5339 Total Confirmed Cases in Afghanistan, respectively, so the thick dash-dotted line passes through 477 = (8676-5339)/7 on 21 May.
For an overview of all related visualizations, and a more detailled description, see WHO Covid diagram set#Available country diagrams Jan-Aug 2020 (daily). |
| Date | |
| Source | Own work |
| Author | Jochen Burghardt |
Licensing[edit]
I, the copyright holder of this work, hereby publish it under the following license:
This file is licensed under the Creative Commons Attribution-Share Alike 4.0 International license.
- You are free:
- to share – to copy, distribute and transmit the work
- to remix – to adapt the work
- Under the following conditions:
- attribution – You must give appropriate credit, provide a link to the license, and indicate if changes were made. You may do so in any reasonable manner, but not in any way that suggests the licensor endorses you or your use.
- share alike – If you remix, transform, or build upon the material, you must distribute your contributions under the same or compatible license as the original.
Gnuplot source code[edit]
| Gnuplot source code |
|---|
set term pdf size 22,13
set term pdf font "sans,20"
set output "WHO_Covid_C_Guatemala.pdf"
set key autotitle columnhead
set termoption noenhanced
# (1) norm: 624 153 236 001
# (2) dist: 1,0:245 2,0:265 2,1:155
# (3,4) dist max: 265 2:236--0:624
# (4) right: 1 0 0 1
# (6,7) scMax: 250 625
# (8) scale: [1:100] [1:10] [1:10] [1:1]


set xrange [-1:212]
set yrange [0:250]
set y2range [0:625]
set xtics 3650,100
set ytics 25 textcolor "#e51e10"
set y2tics 75 textcolor "#0072b2"
set grid y y2

set title "Guatemala"

$data <<EOF
rep day "confirmed [1:100]" "-~confirmed [1:10]" "deaths [1:10]" "-~deaths [1:1]"
1	Jan	.	-	.	-
2	""	.	-	.	-
3	""	.	-	.	-
-	-	-	-	-	-
4	""	.	-	.	-
5	25	.	-	.	-
6	""	.	-	.	-
7	""	.	-	.	-
8	""	.	-	.	-
9	""	.	-	.	-
10	""	.	-	.	-
11	""	.	-	.	-
12	Feb	.	-	.	-
13	""	.	-	.	-
14	""	.	-	.	-
15	""	.	-	.	-
16	05	.	-	.	-
17	""	.	-	.	-
18	""	.	-	.	-
19	""	.	-	.	-
20	""	.	-	.	-
21	10	.	-	.	-
22	""	.	-	.	-
23	""	.	-	.	-
24	""	.	-	.	-
25	""	.	-	.	-
26	15	.	-	.	-
27	""	.	-	.	-
28	""	.	-	.	-
29	""	.	-	.	-
30	""	.	-	.	-
31	20	.	-	.	-
32	""	.	-	.	-
33	""	.	-	.	-
34	""	.	-	.	-
35	""	.	-	.	-
36	25	.	-	.	-
37	""	.	-	.	-
38	""	.	-	.	-
39	""	.	-	.	-
40	""	.	-	.	-
41	Mar	.	-	.	-
42	""	.	-	.	-
43	""	.	-	.	-
44	""	.	-	.	-
45	05	.	-	.	-
46	""	.	-	.	-
47	""	.	-	.	-
48	""	.	-	.	-
49	""	.	-	.	-
50	10	.	-	.	-
51	""	.	-	.	-
52	""	.	-	.	-
53	""	.	-	.	-
54	""	.	-	.	-
55	15	.	-	.	-
56	""	1	-	1	-
57	""	1	-	1	-
58	""	6	-	1	-
59	""	6	-	1	-
60	20	9	-	1	-
61	""	12	-	1	-
62	""	12	-	1	-
63	""	18	2	1	0
64	""	20	3	1	0
65	25	21	2	1	0
66	""	24	3	1	0
67	""	24	2	1	0
68	""	25	2	1	0
69	""	32	2	1	0
70	""	34	3	1	0
71	""	36	2	1	0
72	Apr	36	2	1	0
73	""	39	2	1	0
74	""	47	4	1	0
75	""	50	3	1	0
76	05	50	3	1	0
77	""	61	4	2	0
78	""	70	4	3	0
79	""	77	6	3	1
80	""	87	7	3	0
81	10	95	7	3	0
82	""	126	11	3	1
83	""	137	12	3	0
84	""	153	13	3	0
85	""	156	13	5	0
86	15	167	13	5	1
87	""	180	13	5	0
88	""	196	14	5	0
89	""	214	13	7	1
90	""	235	14	7	0
91	20	257	15	7	1
92	""	289	19	7	0
93	""	294	18	9	1
94	""	316	19	8	0
95	""	342	21	10	1
96	25	384	24	11	0
97	""	430	28	13	1
98	""	473	31	15	1
99	""	500	30	15	2
100	""	530	34	15	0
101	""	557	34	16	2
102	May	585	35	16	0
103	""	599	31	16	1
104	""	644	30	18	1
105	""	688	31	19	0
106	05	703	29	17	1
107	""	730	29	19	0
108	""	763	29	19	1
109	""	798	31	21	0
110	""	832	33	23	1
111	10	900	36	24	1
112	""	967	40	24	1
113	""	1052	50	26	1
114	""	1114	55	26	1
115	""	1199	62	27	1
116	15	1342	78	29	2
117	""	1518	98	29	0
118	""	1643	106	30	1
119	""	1763	114	33	2
120	""	1912	123	35	1
121	20	2001	126	38	2
122	""	2133	134	43	2
123	""	2265	132	45	2
124	""	2512	142	48	3
125	""	2743	157	53	3
126	25	3054	184	57	4
127	""	3424	216	58	3
128	""	3760	252	59	3
129	""	3954	260	63	3
130	""	4145	268	68	3
131	""	4348	263	80	5
132	""	4607	266	90	5
133	Jun	4739	241	102	6
134	""	5087	237	108	7
135	""	5336	225	116	9
136	""	5586	233	123	8
137	05	5760	231	143	11
138	""	6154	258	158	11
139	""	6485	268	216	18
140	""	6792	294	230	18
141	""	7055	281	252	21
142	10	7502	309	267	21
143	""	7866	326	289	24
144	""	8221	352	316	25
145	""	8561	343	334	25
146	""	8982	357	351	19
147	15	9491	386	367	20
148	""	9845	398	384	19
149	""	10272	396	399	19
150	""	10706	406	418	18
151	""	11251	433	432	17
152	20	11868	472	449	16
153	""	12509	504	483	19
154	""	12755	466	514	21
155	""	13145	472	531	21
156	""	13769	499	547	21
157	25	14540	548	582	23
158	""	14819	510	601	25
159	""	15619	535	623	24
160	""	15828	475	672	27
161	""	16397	520	706	28
162	""	16930	541	727	28
163	Jul	17409	520	746	28
164	""	18096	508	773	28
165	""	19011	598	817	30
166	""	20072	637	843	32
167	05	21293	780	880	30
168	""	22501	872	920	30
169	""	23248	903	947	32
170	""	23972	937	981	33
171	""	24787	956	1004	33
172	10	25411	915	1053	34
173	""	26658	940	1092	35
174	""	27619	904	1139	37
175	""	28598	871	1172	36
176	""	29355	873	1219	39
177	15	29742	824	1244	38
178	""	30872	869	1302	42
179	""	32074	952	1350	43
180	""	32939	897	1404	44
181	""	33809	885	1443	44
182	20	38042	1349	1449	39
183	""	39039	1383	1502	41
184	""	40229	1498	1531	41
185	""	41135	1466	1573	39
186	""	42192	1446	1632	40
187	25	43283	1478	1669	38
188	""	44492	1526	1699	36
189	""	45053	1001	1734	41
190	""	45059	860	1761	37
191	""	46451	889	1782	36
192	""	47605	924	1835	37
193	""	48826	948	1867	34
194	Aug	49789	930	1924	36
195	""	50979	926	1957	37
196	""	51306	894	1995	37
197	""	51542	926	2013	36
198	05	52365	845	2037	37
199	""	53509	843	2072	34
200	""	54339	788	2119	36
201	""	55270	783	2168	35
202	""	56189	744	2197	34
203	10	56605	757	2211	31
204	""	56987	778	2222	30
205	""	57966	800	2233	28
206	""	59089	797	2267	27
207	""	60284	849	2296	26
208	15	61428	880	2341	24
209	""	62313	875	2355	23
EOF

# confirmed:
set label "62313  " at first 209,623*250/625   left back textcolor "#8080ff"
# -~confirmed:
set label "875    " at first 209, 87           left back textcolor "#ff8080"
set label "1526   " at first 188,152        +3 left back textcolor "#ff8080"
# deaths:
set label "2355   " at first 209,235           left back textcolor "#ff8080"
# -~deaths:
set label "23     " at first 209, 23*250/625   left back textcolor "#8080ff"
set label "44     " at first 180, 44*250/625+3 left back textcolor "#8080ff"

set multiplot
  plot $data using 0:($3/    100*250/625) with lines lc 6 lw 8 dt 1 title at 0.150, 0.920
replot $data using 0:($4/     10        ) with lines lc 7 lw 8 dt 4 title at 0.150, 0.902
replot $data using 0:($5/     10        ) with lines lc 7 lw 5 dt 2 title at 0.150, 0.884
replot $data using 0:($6/      1*250/625) with lines lc 6 lw 5 dt 3 title at 0.150, 0.866

# plot hor axis calendar
replot $data using 0:(0):xticlabel(2) with lines
|
File history
Click on a date/time to view the file as it appeared at that time.
| Date/Time | Thumbnail | Dimensions | User | Comment | |
|---|---|---|---|---|---|
| current | 19:09, 24 September 2020 |  | 3,300 × 1,950 (23 KB) | Jochen Burghardt (talk | contribs) | =={{int:filedesc}}== {{Information |description={{en|1=Diagram of WHO COVID-19 daily data (20 Jan - 16 Aug 2020) for ''"Total Confirmed Cases"'' (thick solid line), its smoothed increment (thick dash-dotted line), ''"Total Deaths"'' (thin dashed line), and its smoothed increment (thin dotted line); see File:WHO_Covid_2020_Jan-Aug_daily_C_Afghanistan.pdf for details.}} |date=2020-09-24 |source={{own}} |author=Jochen Burghardt |permission= |other_versions=[[:File:... |
You cannot overwrite this file.
File usage on Commons
There are no pages that use this file.