File:WHO Covid 2020 Jan-Aug daily C Fr Guiana.pdf
Jump to navigation
Jump to search

Size of this JPG preview of this PDF file: 800 × 473 pixels. Other resolutions: 320 × 189 pixels | 640 × 378 pixels | 1,024 × 605 pixels | 1,280 × 756 pixels | 3,300 × 1,950 pixels.
Original file (3,300 × 1,950 pixels, file size: 22 KB, MIME type: application/pdf)
Captions
Captions
Add a one-line explanation of what this file represents
Summary[edit]
| Description |
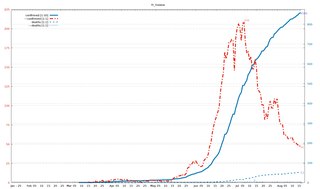
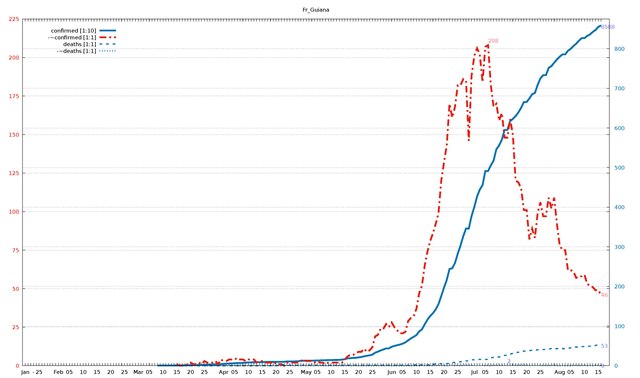
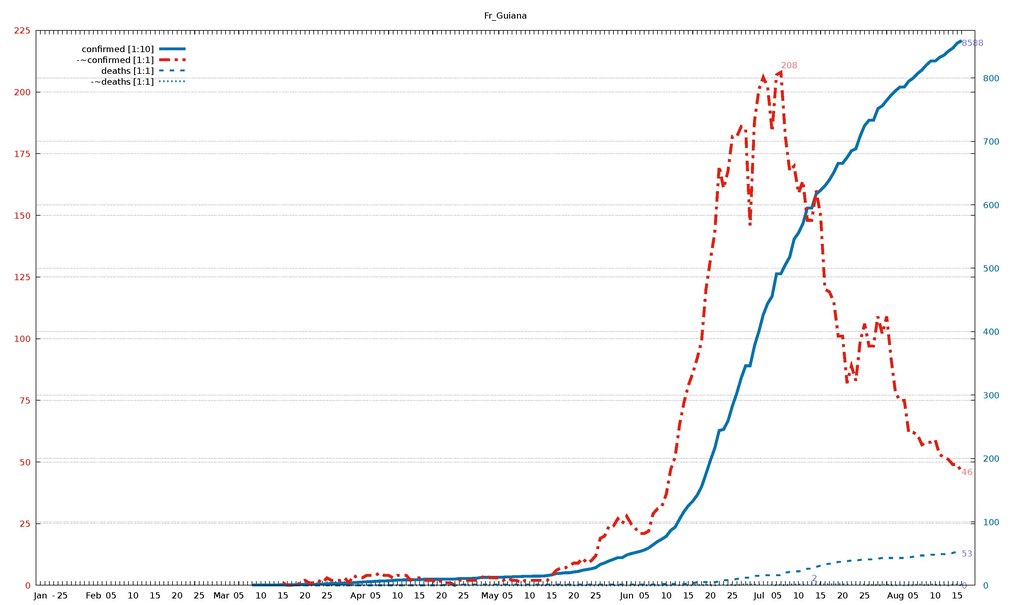
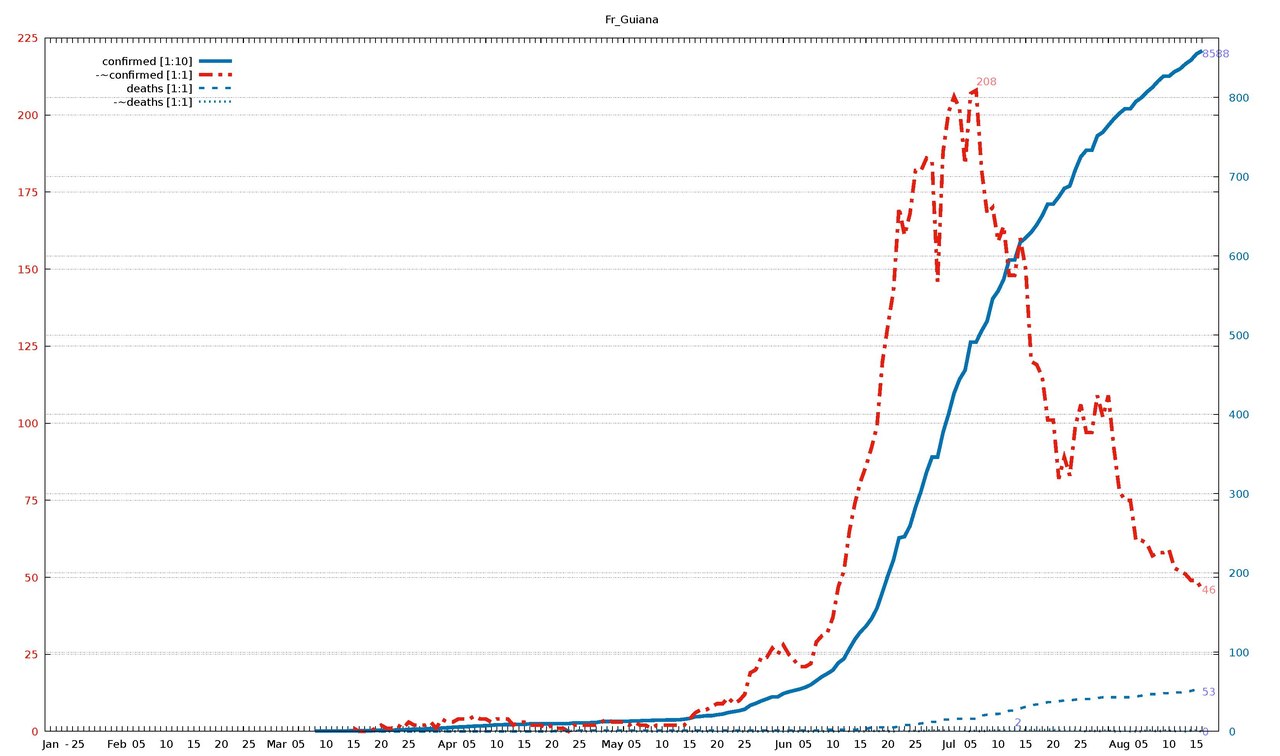
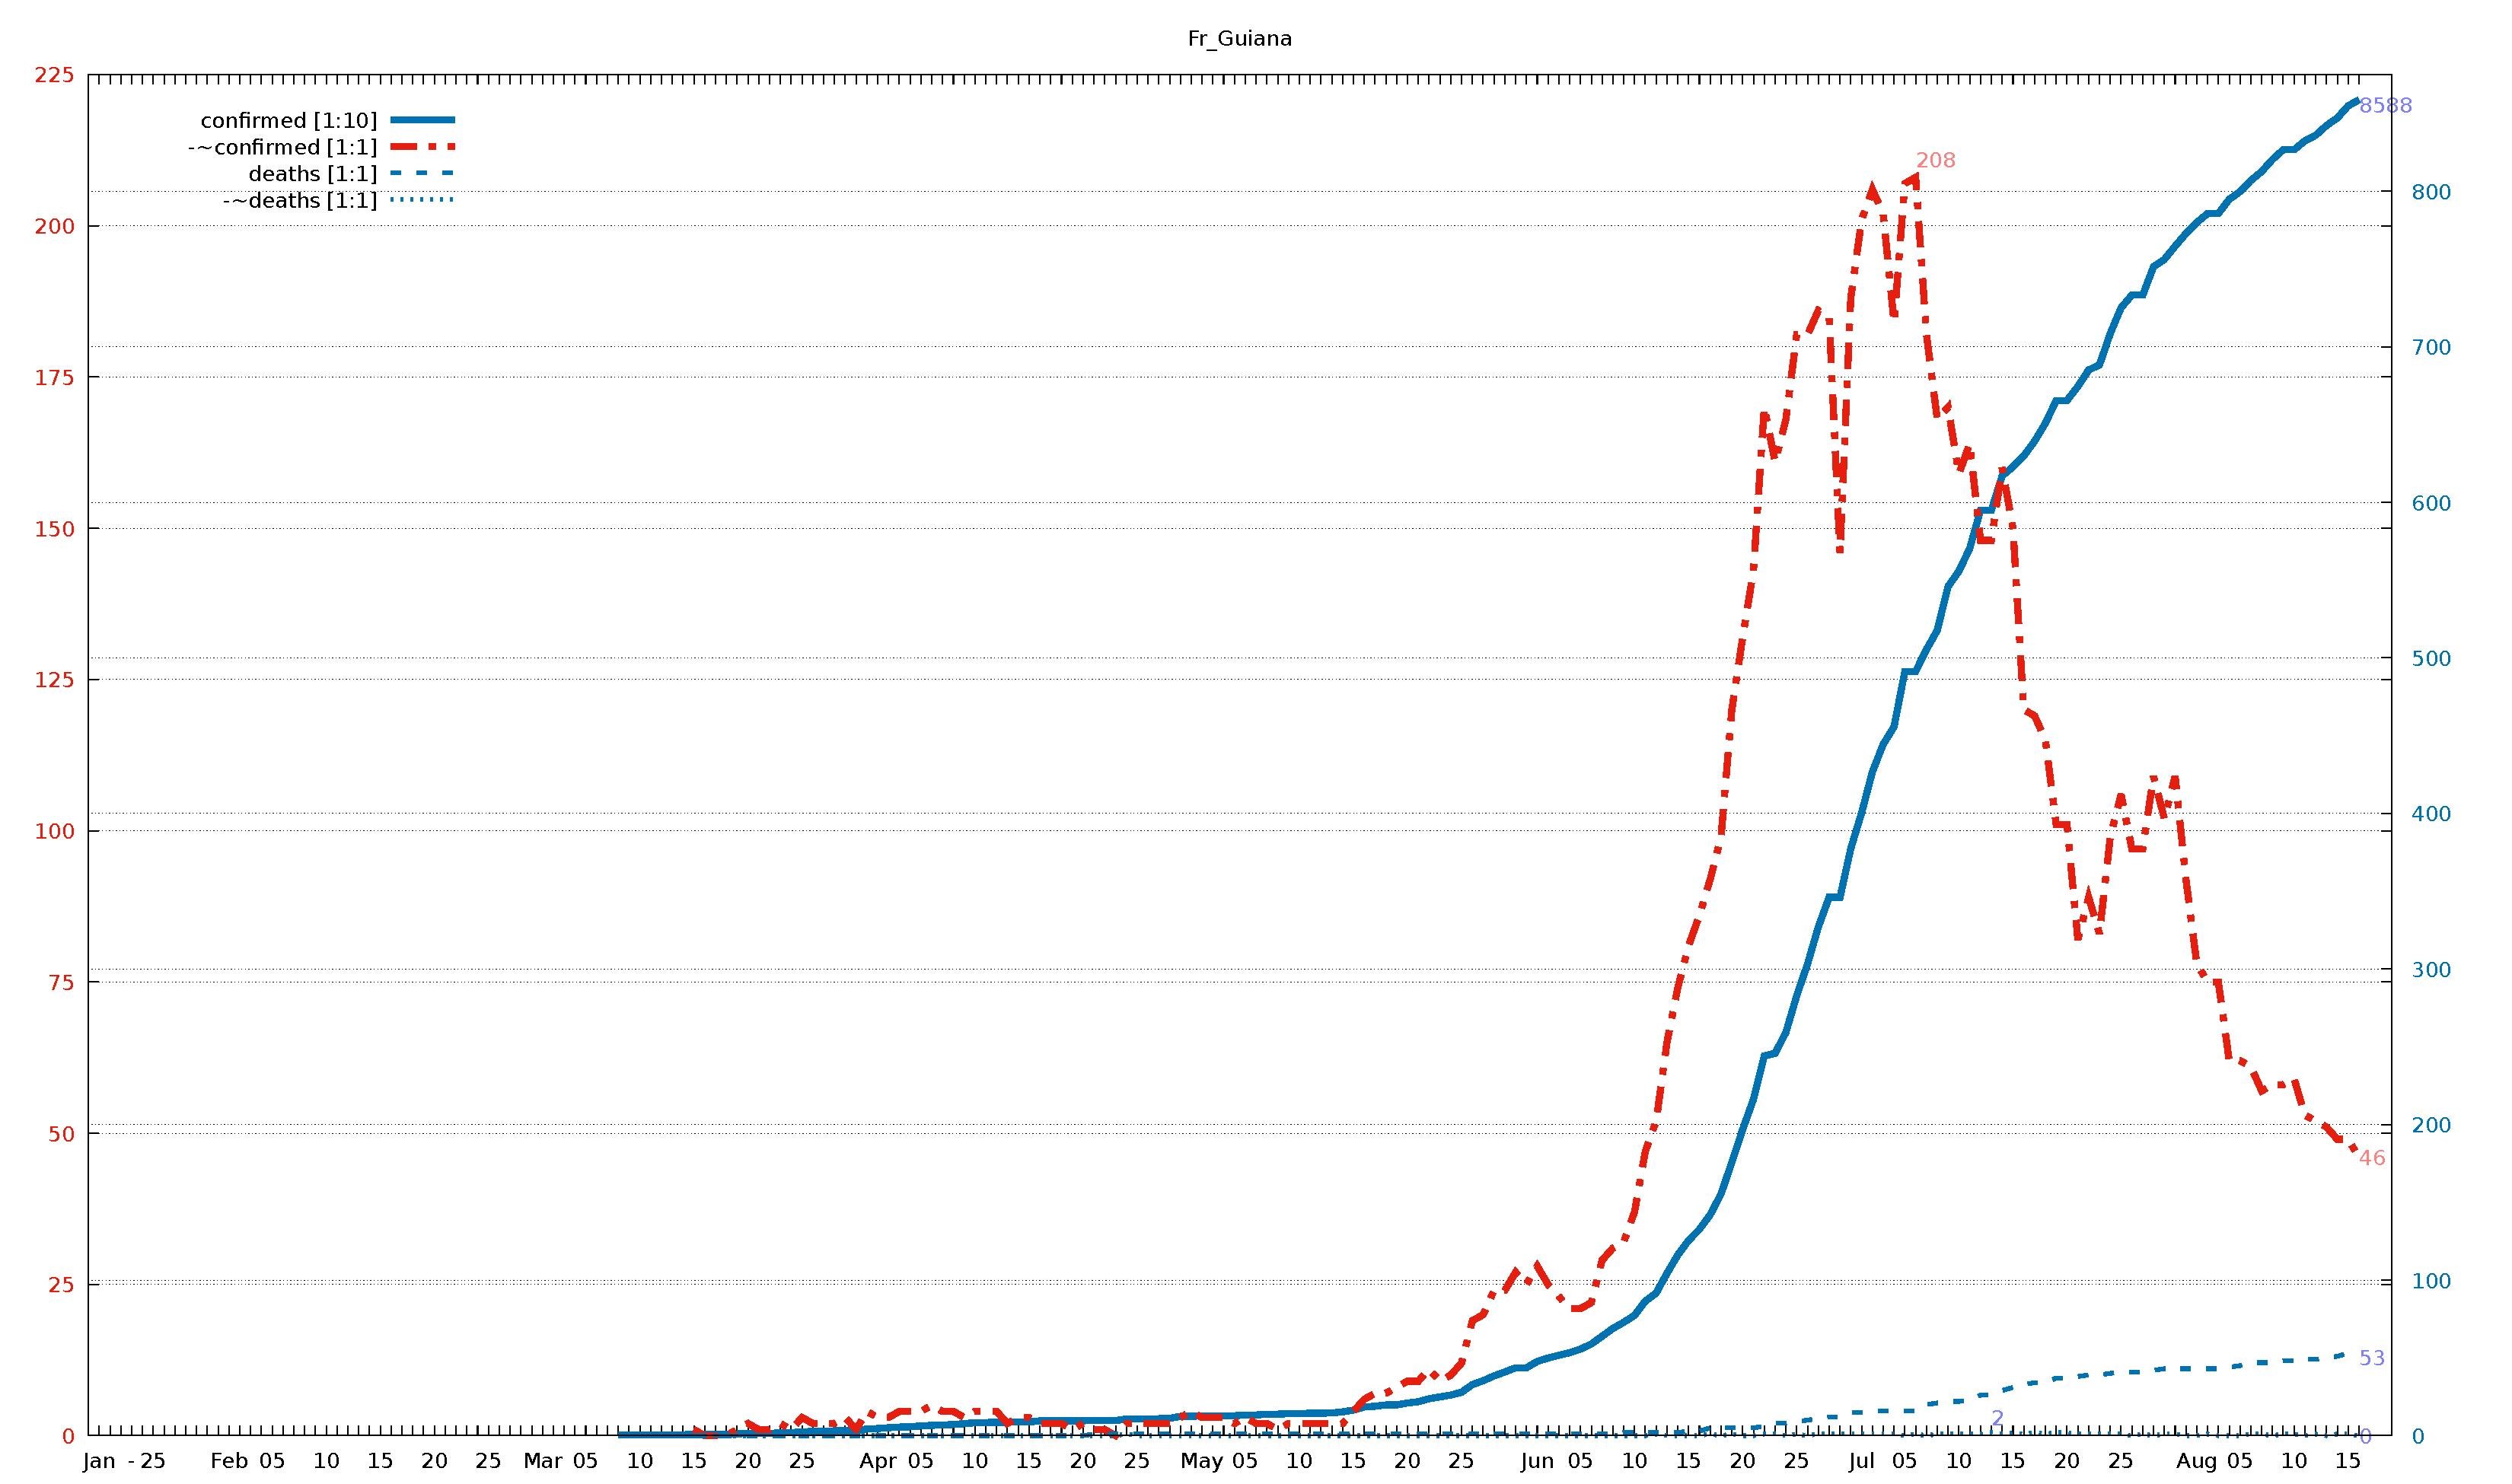
English: Diagram of WHO COVID-19 daily data (20 Jan - 16 Aug 2020) for "Total Confirmed Cases" (thick solid line), its smoothed increment (thick dash-dotted line), "Total Deaths" (thin dashed line) , and its smoothed increment (thin dotted line). Figures are taken from the available situation reports. Red and blue lines refer to the left and right vertical axis, respectively; the scaling factor for each curve is given in the legend. The horizontal axis starts on 20 Jan 2020 (situation report 1), and ends on 16 Aug 2020 (situation report 209). In the smoothed curves, for each day, 1/7 of the difference of the current day's figure and the figure a week ago is shown. For example, in situation report 115 (14 May 2020) and 121 (21 May 2020), there were 8676 and 5339 Total Confirmed Cases in Afghanistan, respectively, so the thick dash-dotted line passes through 477 = (8676-5339)/7 on 21 May.
For an overview of all related visualizations, and a more detailled description, see WHO Covid diagram set#Available country diagrams Jan-Aug 2020 (daily). |
| Date | |
| Source | Own work |
| Author | Jochen Burghardt |
Licensing[edit]
I, the copyright holder of this work, hereby publish it under the following license:
This file is licensed under the Creative Commons Attribution-Share Alike 4.0 International license.
- You are free:
- to share – to copy, distribute and transmit the work
- to remix – to adapt the work
- Under the following conditions:
- attribution – You must give appropriate credit, provide a link to the license, and indicate if changes were made. You may do so in any reasonable manner, but not in any way that suggests the licensor endorses you or your use.
- share alike – If you remix, transform, or build upon the material, you must distribute your contributions under the same or compatible license as the original.
Gnuplot source code[edit]
| Gnuplot source code |
|---|
set term pdf size 22,13
set term pdf font "sans,20"
set output "WHO_Covid_C_Fr_Guiana.pdf"
set key autotitle columnhead
set termoption noenhanced
# (1) norm: 859 208 001 001
# (2) dist: 1,0:242
# (3,4) dist max: 242 1:208--0:859
# (4) right: 1 0 1 1
# (6,7) scMax: 225 875
# (8) scale: [1:10] [1:1] [1:1] [1:1]


set xrange [-1:212]
set yrange [0:225]
set y2range [0:875]
set xtics 3650,100
set ytics 25 textcolor "#e51e10"
set y2tics 100 textcolor "#0072b2"
set grid y y2

set title "Fr_Guiana"

$data <<EOF
rep day "confirmed [1:10]" "-~confirmed [1:1]" "deaths [1:1]" "-~deaths [1:1]"
1	Jan	.	-	.	-
2	""	.	-	.	-
3	""	.	-	.	-
-	-	-	-	-	-
4	""	.	-	.	-
5	25	.	-	.	-
6	""	.	-	.	-
7	""	.	-	.	-
8	""	.	-	.	-
9	""	.	-	.	-
10	""	.	-	.	-
11	""	.	-	.	-
12	Feb	.	-	.	-
13	""	.	-	.	-
14	""	.	-	.	-
15	""	.	-	.	-
16	05	.	-	.	-
17	""	.	-	.	-
18	""	.	-	.	-
19	""	.	-	.	-
20	""	.	-	.	-
21	10	.	-	.	-
22	""	.	-	.	-
23	""	.	-	.	-
24	""	.	-	.	-
25	""	.	-	.	-
26	15	.	-	.	-
27	""	.	-	.	-
28	""	.	-	.	-
29	""	.	-	.	-
30	""	.	-	.	-
31	20	.	-	.	-
32	""	.	-	.	-
33	""	.	-	.	-
34	""	.	-	.	-
35	""	.	-	.	-
36	25	.	-	.	-
37	""	.	-	.	-
38	""	.	-	.	-
39	""	.	-	.	-
40	""	.	-	.	-
41	Mar	.	-	.	-
42	""	.	-	.	-
43	""	.	-	.	-
44	""	.	-	.	-
45	05	.	-	.	-
46	""	.	-	.	-
47	""	.	-	.	-
48	""	5	-	0	-
49	""	5	-	0	-
50	10	5	-	0	-
51	""	5	-	0	-
52	""	5	-	0	-
53	""	6	-	0	-
54	""	6	-	0	-
55	15	7	1	0	0
56	""	7	0	0	0
57	""	7	0	0	0
58	""	7	0	0	0
59	""	11	1	0	0
60	20	15	2	0	0
61	""	15	1	0	0
62	""	15	1	0	0
63	""	18	2	0	0
64	""	20	1	0	0
65	25	23	3	0	0
66	""	28	2	0	0
67	""	28	2	0	0
68	""	31	2	0	0
69	""	31	3	0	0
70	""	31	1	0	0
71	""	43	4	0	0
72	Apr	46	3	0	0
73	""	51	3	0	0
74	""	55	4	0	0
75	""	57	4	0	0
76	05	62	4	0	0
77	""	66	5	0	0
78	""	68	4	0	0
79	""	72	4	0	0
80	""	77	3	0	0
81	10	83	4	0	0
82	""	84	4	0	0
83	""	86	4	0	0
84	""	86	2	0	0
85	""	88	3	0	0
86	15	88	3	0	0
87	""	95	2	0	0
88	""	96	2	0	0
89	""	96	2	0	0
90	""	96	1	0	0
91	20	96	2	0	0
92	""	97	1	1	0
93	""	97	1	1	0
94	""	97	0	1	0
95	""	107	2	1	1
96	25	109	2	1	0
97	""	109	2	1	0
98	""	109	2	1	0
99	""	111	2	1	0
100	""	124	3	1	0
101	""	125	4	1	0
102	May	126	3	1	0
103	""	128	3	1	0
104	""	128	3	1	0
105	""	128	2	1	0
106	05	133	3	1	0
107	""	133	2	1	0
108	""	138	2	1	0
109	""	138	1	1	0
110	""	141	2	1	0
111	10	141	2	1	0
112	""	144	2	1	0
113	""	144	2	1	0
114	""	146	2	1	0
115	""	153	2	1	0
116	15	164	4	1	0
117	""	184	6	1	0
118	""	189	7	1	0
119	""	197	7	1	0
120	""	197	8	1	0
121	20	210	9	1	0
122	""	218	9	1	0
123	""	237	11	1	0
124	""	249	9	1	0
125	""	261	10	1	0
126	25	279	12	1	0
127	""	328	19	1	0
128	""	353	20	1	0
129	""	384	24	1	0
130	""	409	24	1	0
131	""	436	27	1	0
132	""	436	25	1	0
133	Jun	477	28	1	0
134	""	499	25	1	0
135	""	517	23	1	0
136	""	533	21	1	0
137	05	556	21	1	0
138	""	589	22	1	0
139	""	639	29	1	0
140	""	689	31	1	0
141	""	729	32	2	0
142	10	773	37	2	0
143	""	865	47	2	0
144	""	917	52	2	1
145	""	1043	65	2	0
146	""	1161	74	2	0
147	15	1255	81	3	0
148	""	1326	86	3	0
149	""	1421	92	5	1
150	""	1554	99	5	0
151	""	1758	120	5	1
152	20	1969	132	5	0
153	""	2163	143	5	0
154	""	2441	170	6	1
155	""	2458	161	8	1
156	""	2593	168	8	0
157	25	2827	182	9	1
158	""	3033	182	10	0
159	""	3270	186	11	1
160	""	3461	185	12	1
161	""	3461	146	12	1
162	""	3774	188	15	1
163	Jul	4004	201	15	1
164	""	4268	206	16	1
165	""	4444	202	16	1
166	""	4558	184	16	1
167	05	4913	207	16	0
168	""	4913	208	16	1
169	""	5054	182	20	0
170	""	5178	168	21	1
171	""	5459	170	22	1
172	10	5558	159	22	1
173	""	5704	164	23	1
174	""	5949	148	26	1
175	""	5949	148	26	2
176	""	6170	160	29	1
177	15	6229	150	31	2
178	""	6299	120	33	1
179	""	6393	119	34	2
180	""	6509	115	34	1
181	""	6655	101	37	2
182	20	6655	101	37	2
183	""	6745	82	38	1
184	""	6851	89	39	1
185	""	6883	83	39	1
186	""	7086	99	40	1
187	25	7251	106	41	1
188	""	7332	97	41	0
189	""	7332	97	41	1
190	""	7514	109	42	0
191	""	7562	102	43	1
192	""	7647	109	43	1
193	""	7728	92	43	0
194	Aug	7799	78	43	0
195	""	7857	75	43	1
196	""	7857	75	43	0
197	""	7948	62	44	0
198	05	7998	62	45	0
199	""	8069	61	47	1
200	""	8127	57	47	1
201	""	8204	58	47	0
202	""	8267	58	48	1
203	10	8267	59	48	1
204	""	8324	53	49	0
205	""	8360	52	49	1
206	""	8423	51	50	0
207	""	8471	49	51	1
208	15	8549	49	53	1
209	""	8588	46	53	0
EOF

# confirmed:
set label "8588   " at first 209,858*225/875   left back textcolor "#8080ff"
# -~confirmed:
set label "46     " at first 209, 46           left back textcolor "#ff8080"
set label "208    " at first 168,208        +3 left back textcolor "#ff8080"
# deaths:
set label "53     " at first 209, 53*225/875   left back textcolor "#8080ff"
# -~deaths:
set label "0      " at first 209,  0*225/875   left back textcolor "#8080ff"
set label "2      " at first 175,  2*225/875+3 left back textcolor "#8080ff"

set multiplot
  plot $data using 0:($3/     10*225/875) with lines lc 6 lw 8 dt 1 title at 0.150, 0.920
replot $data using 0:($4/      1        ) with lines lc 7 lw 8 dt 4 title at 0.150, 0.902
replot $data using 0:($5/      1*225/875) with lines lc 6 lw 5 dt 2 title at 0.150, 0.884
replot $data using 0:($6/      1*225/875) with lines lc 6 lw 5 dt 3 title at 0.150, 0.866

# plot hor axis calendar
replot $data using 0:(0):xticlabel(2) with lines
|
File history
Click on a date/time to view the file as it appeared at that time.
| Date/Time | Thumbnail | Dimensions | User | Comment | |
|---|---|---|---|---|---|
| current | 19:05, 24 September 2020 |  | 3,300 × 1,950 (22 KB) | Jochen Burghardt (talk | contribs) | =={{int:filedesc}}== {{Information |description={{en|1=Diagram of WHO COVID-19 daily data (20 Jan - 16 Aug 2020) for ''"Total Confirmed Cases"'' (thick solid line), its smoothed increment (thick dash-dotted line), ''"Total Deaths"'' (thin dashed line), and its smoothed increment (thin dotted line); see File:WHO_Covid_2020_Jan-Aug_daily_C_Afghanistan.pdf for details.}} |date=2020-09-24 |source={{own}} |author=Jochen Burghardt |permission= |other_versions=[[:File:... |
You cannot overwrite this file.
File usage on Commons
There are no pages that use this file.