File:WHO Covid 2020 Jan-Aug daily C Ethiopia.pdf
Jump to navigation
Jump to search

Size of this JPG preview of this PDF file: 800 × 473 pixels. Other resolutions: 320 × 189 pixels | 640 × 378 pixels | 1,024 × 605 pixels | 1,280 × 756 pixels | 3,300 × 1,950 pixels.
Original file (3,300 × 1,950 pixels, file size: 23 KB, MIME type: application/pdf)
Captions
Captions
Add a one-line explanation of what this file represents
Summary[edit]
| Description |
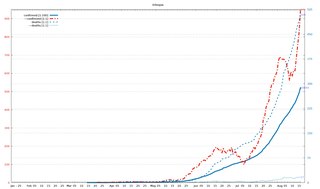
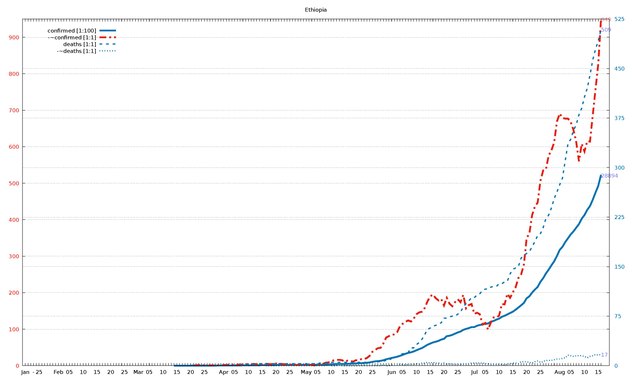
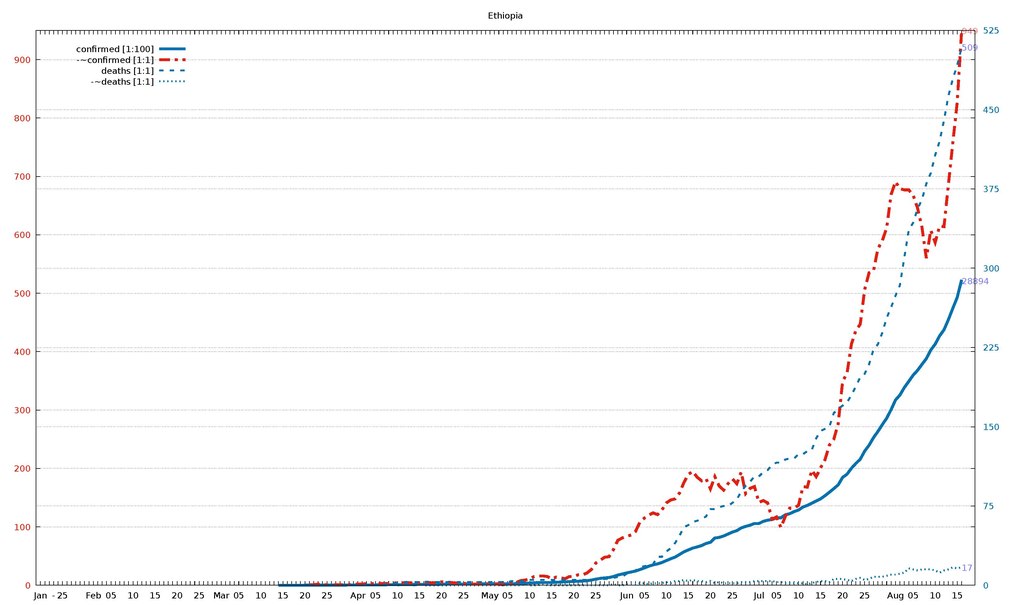
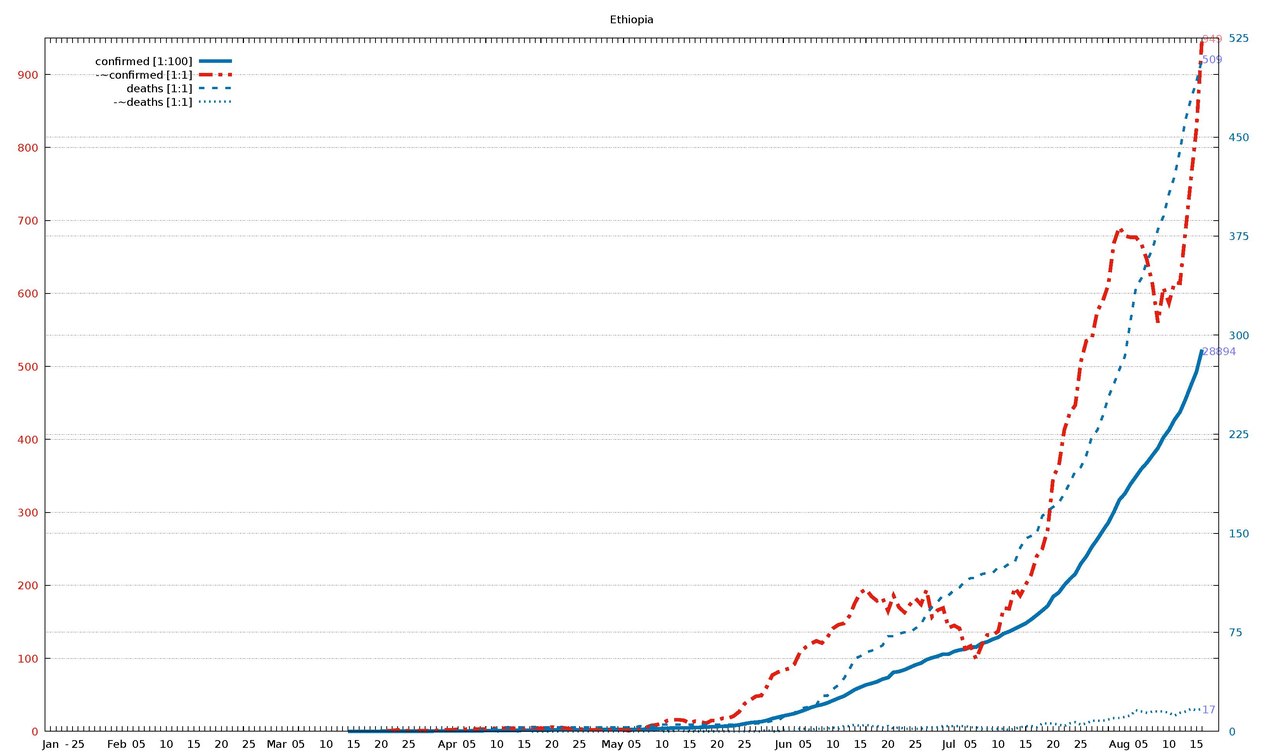
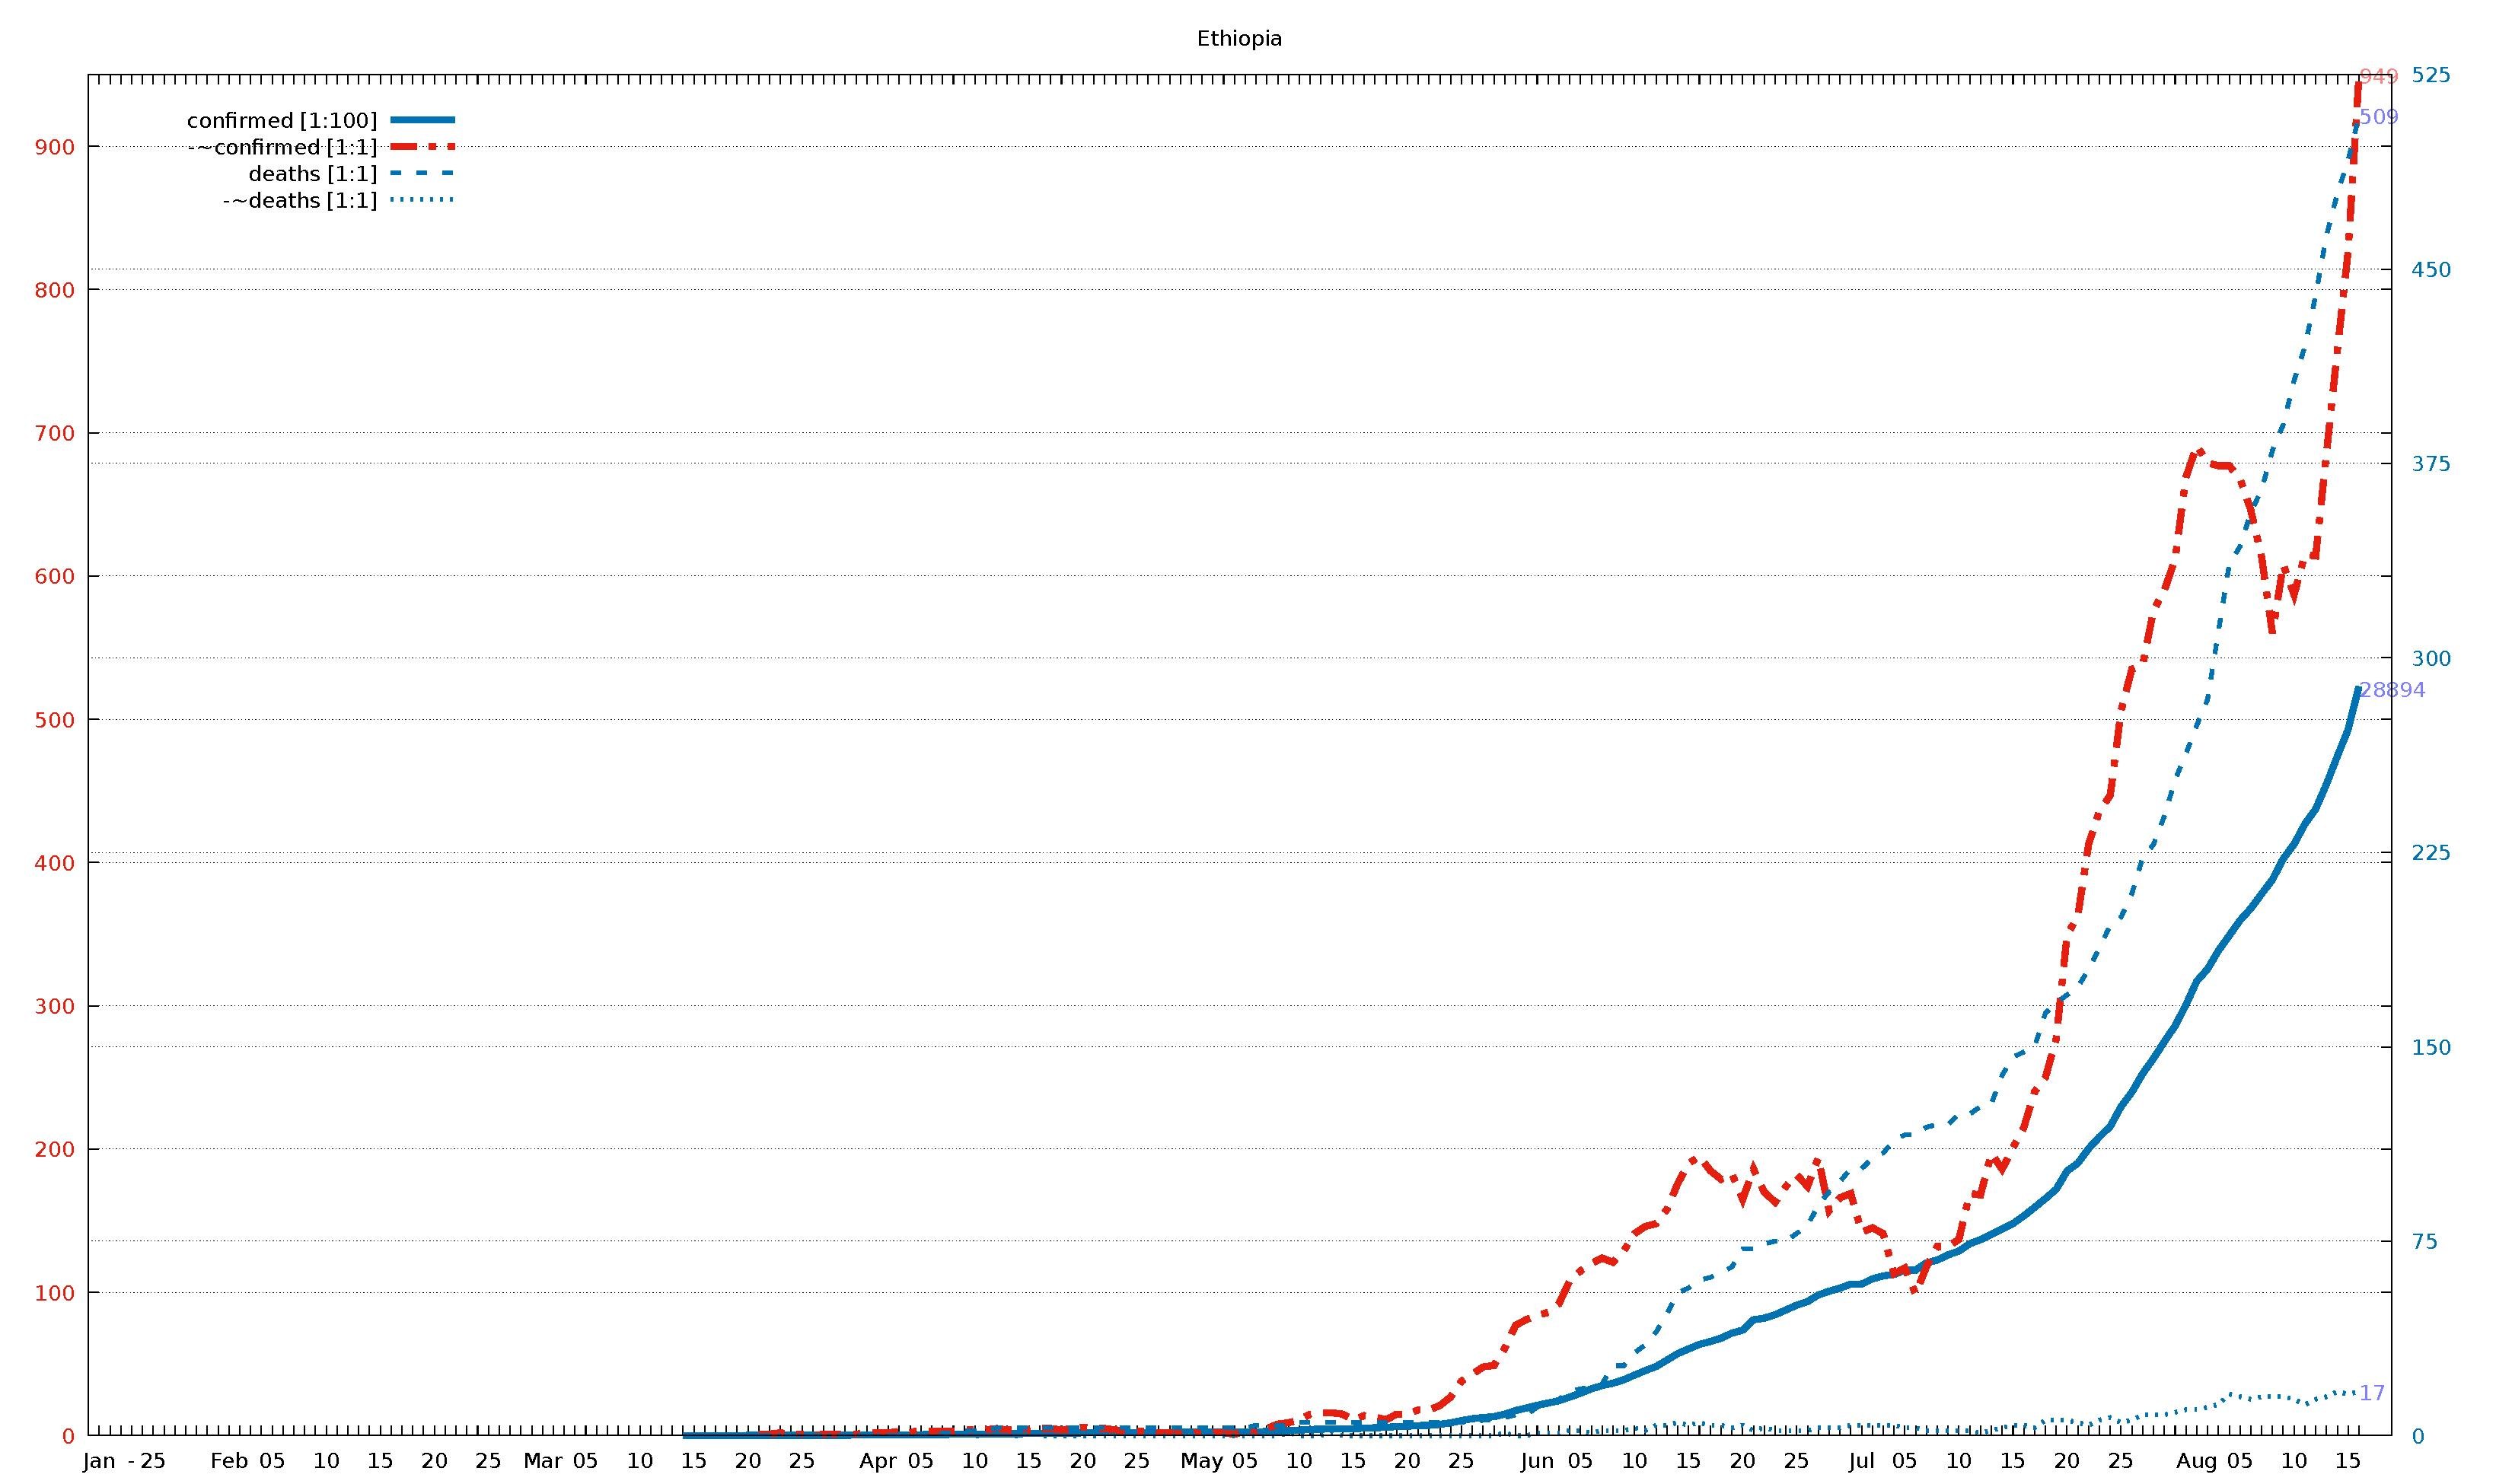
English: Diagram of WHO COVID-19 daily data (20 Jan - 16 Aug 2020) for "Total Confirmed Cases" (thick solid line), its smoothed increment (thick dash-dotted line), "Total Deaths" (thin dashed line) , and its smoothed increment (thin dotted line). Figures are taken from the available situation reports. Red and blue lines refer to the left and right vertical axis, respectively; the scaling factor for each curve is given in the legend. The horizontal axis starts on 20 Jan 2020 (situation report 1), and ends on 16 Aug 2020 (situation report 209). In the smoothed curves, for each day, 1/7 of the difference of the current day's figure and the figure a week ago is shown. For example, in situation report 115 (14 May 2020) and 121 (21 May 2020), there were 8676 and 5339 Total Confirmed Cases in Afghanistan, respectively, so the thick dash-dotted line passes through 477 = (8676-5339)/7 on 21 May.
For an overview of all related visualizations, and a more detailled description, see WHO Covid diagram set#Available country diagrams Jan-Aug 2020 (daily). |
| Date | |
| Source | Own work |
| Author | Jochen Burghardt |
Licensing[edit]
I, the copyright holder of this work, hereby publish it under the following license:
This file is licensed under the Creative Commons Attribution-Share Alike 4.0 International license.
- You are free:
- to share – to copy, distribute and transmit the work
- to remix – to adapt the work
- Under the following conditions:
- attribution – You must give appropriate credit, provide a link to the license, and indicate if changes were made. You may do so in any reasonable manner, but not in any way that suggests the licensor endorses you or your use.
- share alike – If you remix, transform, or build upon the material, you must distribute your contributions under the same or compatible license as the original.
Gnuplot source code[edit]
| Gnuplot source code |
|---|
set term pdf size 22,13
set term pdf font "sans,20"
set output "WHO_Covid_C_Ethiopia.pdf"
set key autotitle columnhead
set termoption noenhanced
# (1) norm: 289 949 509 001
# (2) dist: 1,0:304 2,0:177 2,1:187
# (3,4) dist max: 304 1:949--0:289
# (4) right: 1 0 1 1
# (6,7) scMax: 950 525
# (8) scale: [1:100] [1:1] [1:1] [1:1]


set xrange [-1:212]
set yrange [0:950]
set y2range [0:525]
set xtics 3650,100
set ytics 100 textcolor "#e51e10"
set y2tics 75 textcolor "#0072b2"
set grid y y2

set title "Ethiopia"

$data <<EOF
rep day "confirmed [1:100]" "-~confirmed [1:1]" "deaths [1:1]" "-~deaths [1:1]"
1	Jan	.	-	.	-
2	""	.	-	.	-
3	""	.	-	.	-
-	-	-	-	-	-
4	""	.	-	.	-
5	25	.	-	.	-
6	""	.	-	.	-
7	""	.	-	.	-
8	""	.	-	.	-
9	""	.	-	.	-
10	""	.	-	.	-
11	""	.	-	.	-
12	Feb	.	-	.	-
13	""	.	-	.	-
14	""	.	-	.	-
15	""	.	-	.	-
16	05	.	-	.	-
17	""	.	-	.	-
18	""	.	-	.	-
19	""	.	-	.	-
20	""	.	-	.	-
21	10	.	-	.	-
22	""	.	-	.	-
23	""	.	-	.	-
24	""	.	-	.	-
25	""	.	-	.	-
26	15	.	-	.	-
27	""	.	-	.	-
28	""	.	-	.	-
29	""	.	-	.	-
30	""	.	-	.	-
31	20	.	-	.	-
32	""	.	-	.	-
33	""	.	-	.	-
34	""	.	-	.	-
35	""	.	-	.	-
36	25	.	-	.	-
37	""	.	-	.	-
38	""	.	-	.	-
39	""	.	-	.	-
40	""	.	-	.	-
41	Mar	.	-	.	-
42	""	.	-	.	-
43	""	.	-	.	-
44	""	.	-	.	-
45	05	.	-	.	-
46	""	.	-	.	-
47	""	.	-	.	-
48	""	.	-	.	-
49	""	.	-	.	-
50	10	.	-	.	-
51	""	.	-	.	-
52	""	.	-	.	-
53	""	.	-	.	-
54	""	1	-	0	-
55	15	1	-	0	-
56	""	1	-	0	-
57	""	5	-	0	-
58	""	5	-	0	-
59	""	6	-	0	-
60	20	9	-	0	-
61	""	9	1	0	0
62	""	9	1	0	0
63	""	11	2	0	0
64	""	11	1	0	0
65	25	12	1	0	0
66	""	12	0	0	0
67	""	12	1	0	0
68	""	16	1	0	0
69	""	16	1	0	0
70	""	21	1	0	0
71	""	23	2	0	0
72	Apr	26	2	0	0
73	""	26	2	0	0
74	""	31	3	0	0
75	""	35	2	0	0
76	05	38	4	0	0
77	""	43	3	1	0
78	""	43	3	1	0
79	""	52	3	1	0
80	""	55	4	2	1
81	10	56	4	2	0
82	""	65	4	2	0
83	""	69	5	3	1
84	""	71	4	3	0
85	""	74	4	3	0
86	15	82	4	3	1
87	""	85	5	3	0
88	""	92	5	3	0
89	""	96	4	3	0
90	""	105	5	3	0
91	20	108	6	3	0
92	""	111	5	3	0
93	""	114	5	3	0
94	""	116	4	3	0
95	""	116	3	3	0
96	25	117	3	3	0
97	""	122	3	3	0
98	""	123	2	3	0
99	""	124	2	3	0
100	""	126	2	3	0
101	""	130	2	3	0
102	May	131	2	3	0
103	""	133	2	3	0
104	""	133	2	3	0
105	""	135	1	3	0
106	05	140	3	3	0
107	""	145	2	4	0
108	""	162	5	4	0
109	""	191	8	4	0
110	""	194	9	4	1
111	10	210	11	5	0
112	""	239	15	5	0
113	""	250	16	5	0
114	""	261	16	5	1
115	""	263	15	5	0
116	15	272	11	5	0
117	""	287	14	5	0
118	""	306	13	5	0
119	""	317	11	5	0
120	""	352	15	5	0
121	20	365	15	5	0
122	""	389	18	5	0
123	""	399	18	5	0
124	""	433	21	5	0
125	""	494	27	5	0
126	25	582	38	5	0
127	""	655	43	5	0
128	""	701	48	6	0
129	""	731	49	6	0
130	""	831	61	7	1
131	""	968	77	8	0
132	""	1063	81	8	0
133	Jun	1172	84	11	1
134	""	1257	86	12	1
135	""	1344	92	14	1
136	""	1486	108	17	2
137	05	1636	115	18	2
138	""	1805	120	19	1
139	""	1934	124	20	2
140	""	2020	121	27	2
141	""	2156	129	27	2
142	10	2336	141	32	3
143	""	2506	146	35	2
144	""	2670	148	40	4
145	""	2915	158	47	4
146	""	3166	176	55	5
147	15	3345	190	57	4
148	""	3521	195	60	5
149	""	3630	185	61	4
150	""	3759	179	63	4
151	""	3954	183	65	3
152	20	4070	165	72	4
153	""	4469	186	72	2
154	""	4532	170	74	3
155	""	4663	163	75	2
156	""	4848	174	75	2
157	25	5034	182	78	2
158	""	5175	174	81	2
159	""	5425	194	89	3
160	""	5570	157	94	3
161	""	5689	166	98	3
162	""	5846	169	103	4
163	Jul	5846	142	103	4
164	""	6048	145	107	4
165	""	6163	141	109	4
166	""	6217	113	114	4
167	05	6386	117	116	3
168	""	6386	99	116	3
169	""	6666	118	119	2
170	""	6774	132	120	2
171	""	6973	132	120	2
172	10	7120	137	124	2
173	""	7402	169	124	2
174	""	7560	168	127	1
175	""	7766	197	128	2
176	""	7969	186	139	3
177	15	8181	201	146	4
178	""	8475	215	148	4
179	""	8803	240	150	3
180	""	9147	250	163	6
181	""	9503	277	167	6
182	20	10207	349	170	6
183	""	10511	363	173	5
184	""	11072	413	180	4
185	""	11524	436	188	6
186	""	11933	447	197	7
187	25	12693	506	200	5
188	""	13248	535	209	6
189	""	13968	538	223	8
190	""	14547	576	228	8
191	""	15200	590	239	8
192	""	15810	612	253	9
193	""	16615	669	263	10
194	Aug	17530	691	274	10
195	""	17999	679	284	11
196	""	18706	677	310	12
197	""	19289	677	336	16
198	05	19875	668	343	15
199	""	20336	646	356	14
200	""	20900	613	365	15
201	""	21452	560	380	15
202	""	22253	608	390	15
203	10	22818	587	407	14
204	""	23591	615	420	12
205	""	24175	614	440	14
206	""	25136	686	463	15
207	""	26204	757	479	17
208	15	27242	827	492	16
209	""	28894	949	509	17
EOF

# confirmed:
set label "28894  " at first 209,288*950/525   left back textcolor "#8080ff"
# -~confirmed:
set label "949    " at first 209,949           left back textcolor "#ff8080"
# deaths:
set label "509    " at first 209,509*950/525   left back textcolor "#8080ff"
# -~deaths:
set label "17     " at first 209, 17*950/525   left back textcolor "#8080ff"

set multiplot
  plot $data using 0:($3/    100*950/525) with lines lc 6 lw 8 dt 1 title at 0.150, 0.920
replot $data using 0:($4/      1        ) with lines lc 7 lw 8 dt 4 title at 0.150, 0.902
replot $data using 0:($5/      1*950/525) with lines lc 6 lw 5 dt 2 title at 0.150, 0.884
replot $data using 0:($6/      1*950/525) with lines lc 6 lw 5 dt 3 title at 0.150, 0.866

# plot hor axis calendar
replot $data using 0:(0):xticlabel(2) with lines
|
File history
Click on a date/time to view the file as it appeared at that time.
| Date/Time | Thumbnail | Dimensions | User | Comment | |
|---|---|---|---|---|---|
| current | 19:03, 24 September 2020 |  | 3,300 × 1,950 (23 KB) | Jochen Burghardt (talk | contribs) | =={{int:filedesc}}== {{Information |description={{en|1=Diagram of WHO COVID-19 daily data (20 Jan - 16 Aug 2020) for ''"Total Confirmed Cases"'' (thick solid line), its smoothed increment (thick dash-dotted line), ''"Total Deaths"'' (thin dashed line), and its smoothed increment (thin dotted line); see File:WHO_Covid_2020_Jan-Aug_daily_C_Afghanistan.pdf for details.}} |date=2020-09-24 |source={{own}} |author=Jochen Burghardt |permission= |other_versions=[[:File:... |
You cannot overwrite this file.
File usage on Commons
There are no pages that use this file.