File:WHO Covid 2020 Jan-Aug daily C Dominican Republic.pdf
Jump to navigation
Jump to search

Size of this JPG preview of this PDF file: 800 × 473 pixels. Other resolutions: 320 × 189 pixels | 640 × 378 pixels | 1,024 × 605 pixels | 1,280 × 756 pixels | 3,300 × 1,950 pixels.
Original file (3,300 × 1,950 pixels, file size: 25 KB, MIME type: application/pdf)
Captions
Captions
Add a one-line explanation of what this file represents
Summary[edit]
| Description |
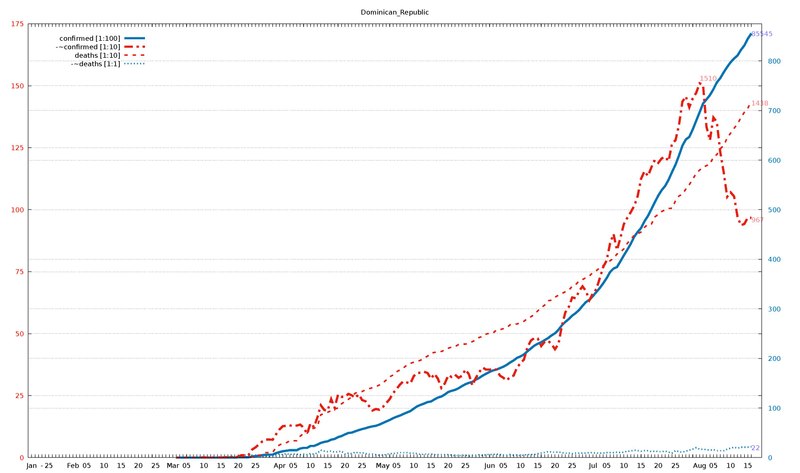
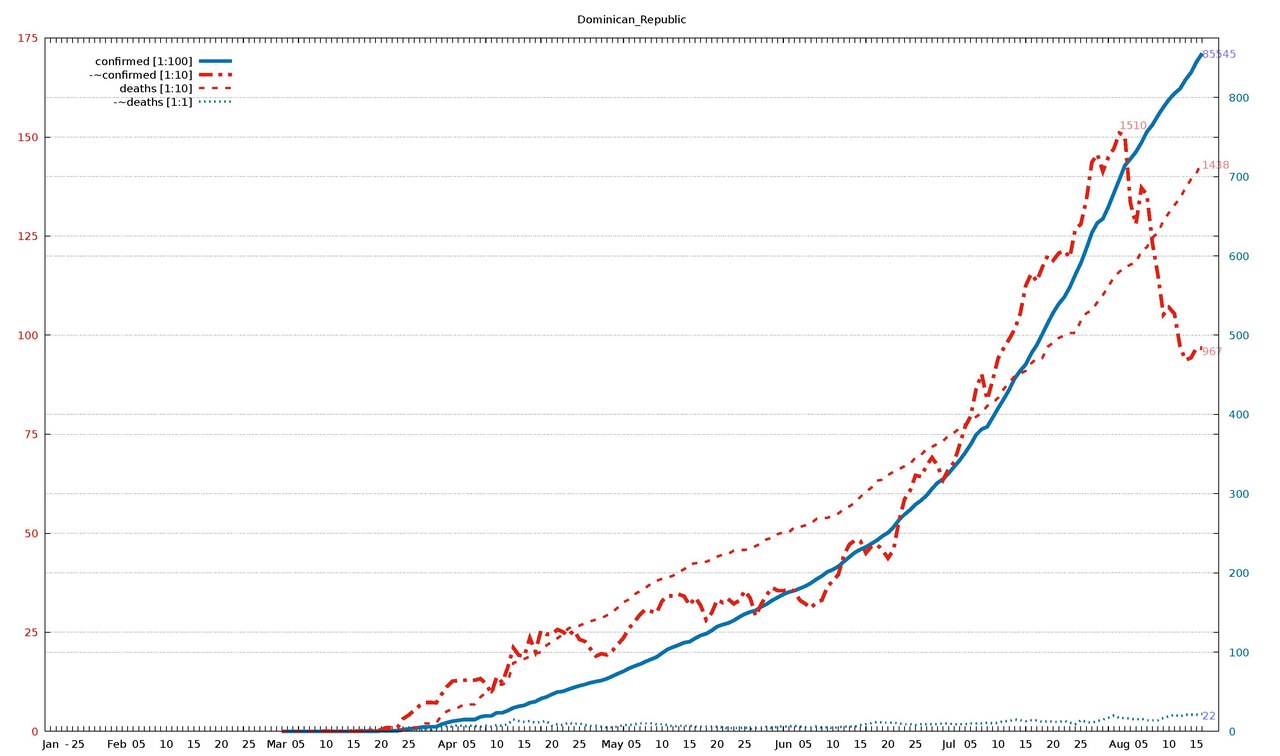
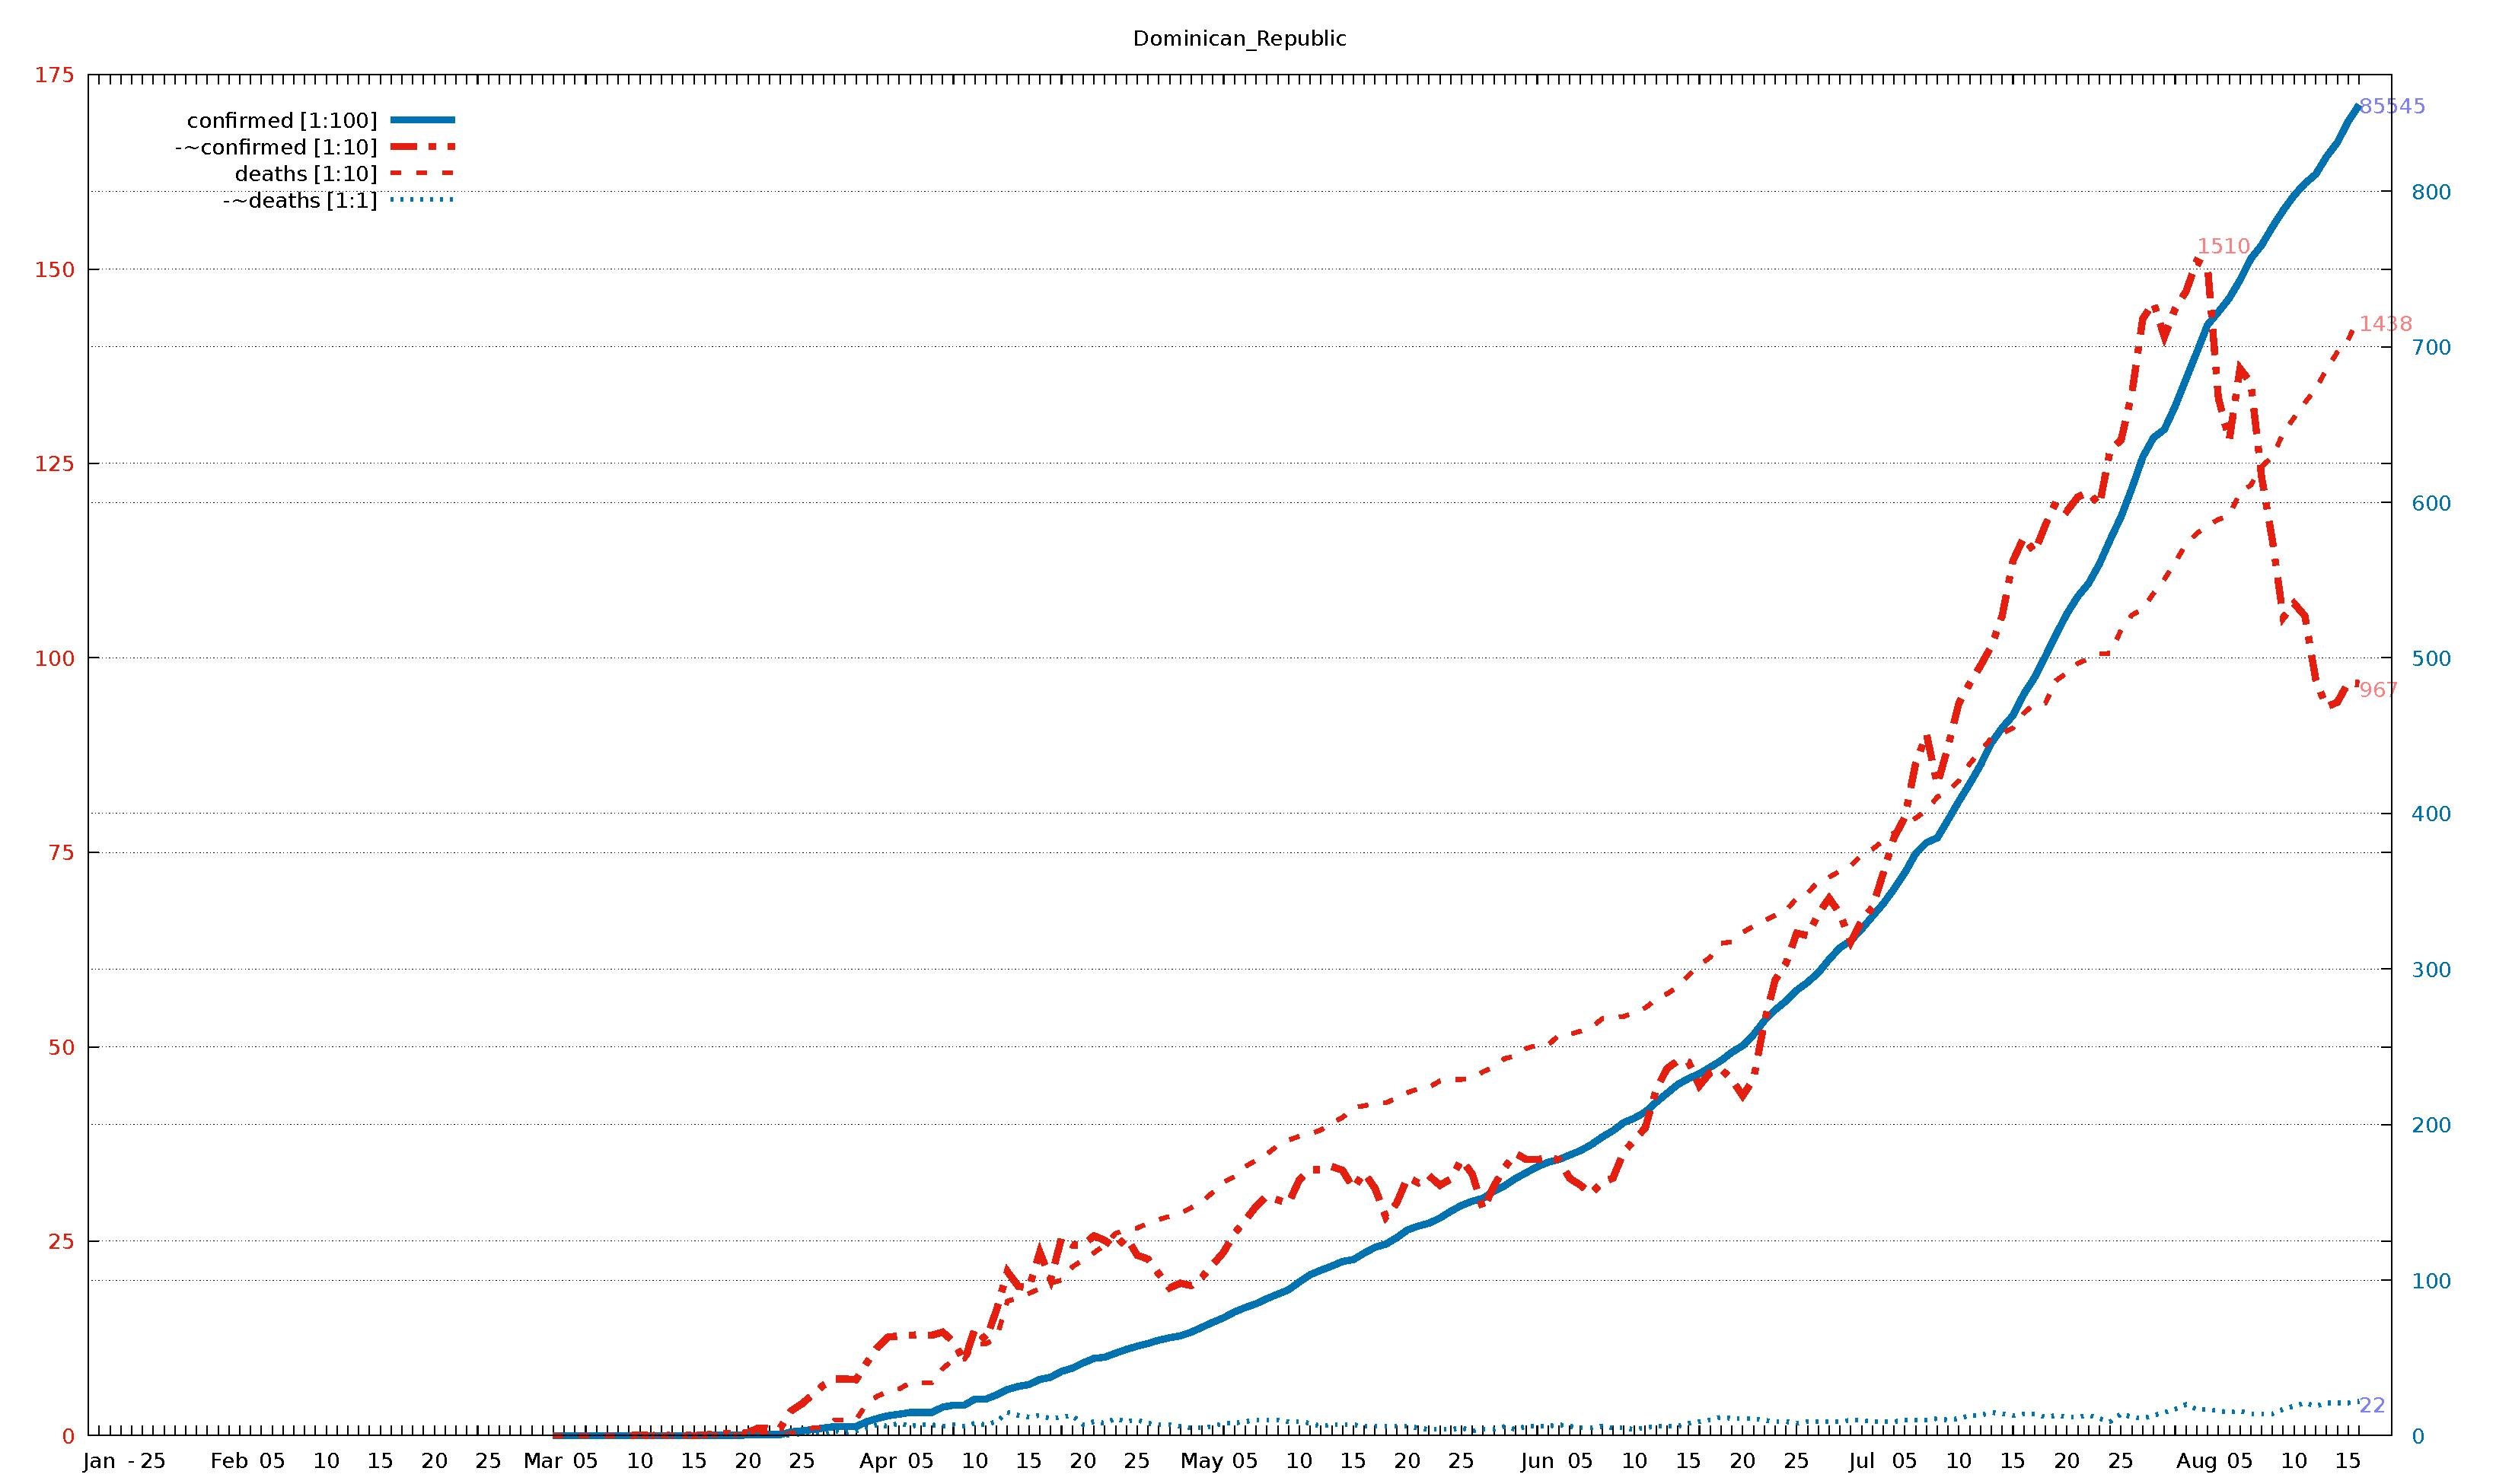
English: Diagram of WHO COVID-19 daily data (20 Jan - 16 Aug 2020) for "Total Confirmed Cases" (thick solid line), its smoothed increment (thick dash-dotted line), "Total Deaths" (thin dashed line) , and its smoothed increment (thin dotted line). Figures are taken from the available situation reports. Red and blue lines refer to the left and right vertical axis, respectively; the scaling factor for each curve is given in the legend. The horizontal axis starts on 20 Jan 2020 (situation report 1), and ends on 16 Aug 2020 (situation report 209). In the smoothed curves, for each day, 1/7 of the difference of the current day's figure and the figure a week ago is shown. For example, in situation report 115 (14 May 2020) and 121 (21 May 2020), there were 8676 and 5339 Total Confirmed Cases in Afghanistan, respectively, so the thick dash-dotted line passes through 477 = (8676-5339)/7 on 21 May.
For an overview of all related visualizations, and a more detailled description, see WHO Covid diagram set#Available country diagrams Jan-Aug 2020 (daily). |
| Date | |
| Source | Own work |
| Author | Jochen Burghardt |
Licensing[edit]
I, the copyright holder of this work, hereby publish it under the following license:
This file is licensed under the Creative Commons Attribution-Share Alike 4.0 International license.
- You are free:
- to share – to copy, distribute and transmit the work
- to remix – to adapt the work
- Under the following conditions:
- attribution – You must give appropriate credit, provide a link to the license, and indicate if changes were made. You may do so in any reasonable manner, but not in any way that suggests the licensor endorses you or your use.
- share alike – If you remix, transform, or build upon the material, you must distribute your contributions under the same or compatible license as the original.
Gnuplot source code[edit]
| Gnuplot source code |
|---|
set term pdf size 22,13
set term pdf font "sans,20"
set output "WHO_Covid_C_Dominican_Republic.pdf"
set key autotitle columnhead
set termoption noenhanced
# (1) norm: 856 151 144 001
# (2) dist: 1,0:176 2,0:168 2,1:105
# (3,4) dist max: 176 1:151--0:856
# (4) right: 1 0 0 1
# (6,7) scMax: 175 875
# (8) scale: [1:100] [1:10] [1:10] [1:1]


set xrange [-1:212]
set yrange [0:175]
set y2range [0:875]
set xtics 3650,100
set ytics 25 textcolor "#e51e10"
set y2tics 100 textcolor "#0072b2"
set grid y y2

set title "Dominican_Republic"

$data <<EOF
rep day "confirmed [1:100]" "-~confirmed [1:10]" "deaths [1:10]" "-~deaths [1:1]"
1	Jan	.	-	.	-
2	""	.	-	.	-
3	""	.	-	.	-
-	-	-	-	-	-
4	""	.	-	.	-
5	25	.	-	.	-
6	""	.	-	.	-
7	""	.	-	.	-
8	""	.	-	.	-
9	""	.	-	.	-
10	""	.	-	.	-
11	""	.	-	.	-
12	Feb	.	-	.	-
13	""	.	-	.	-
14	""	.	-	.	-
15	""	.	-	.	-
16	05	.	-	.	-
17	""	.	-	.	-
18	""	.	-	.	-
19	""	.	-	.	-
20	""	.	-	.	-
21	10	.	-	.	-
22	""	.	-	.	-
23	""	.	-	.	-
24	""	.	-	.	-
25	""	.	-	.	-
26	15	.	-	.	-
27	""	.	-	.	-
28	""	.	-	.	-
29	""	.	-	.	-
30	""	.	-	.	-
31	20	.	-	.	-
32	""	.	-	.	-
33	""	.	-	.	-
34	""	.	-	.	-
35	""	.	-	.	-
36	25	.	-	.	-
37	""	.	-	.	-
38	""	.	-	.	-
39	""	.	-	.	-
40	""	.	-	.	-
41	Mar	.	-	.	-
42	""	1	-	0	-
43	""	1	-	0	-
44	""	1	-	0	-
45	05	1	-	0	-
46	""	1	-	0	-
47	""	1	-	0	-
48	""	1	-	0	-
49	""	1	0	0	0
50	10	5	1	0	0
51	""	5	0	0	0
52	""	5	1	0	0
53	""	5	0	0	0
54	""	5	1	0	0
55	15	5	0	0	0
56	""	5	1	0	0
57	""	21	2	1	0
58	""	21	3	1	0
59	""	21	2	1	0
60	20	34	4	2	1
61	""	72	10	2	0
62	""	72	9	2	0
63	""	72	10	2	1
64	""	245	32	3	0
65	25	312	41	6	1
66	""	392	53	10	1
67	""	488	65	10	1
68	""	581	73	20	3
69	""	581	73	20	2
70	""	581	72	20	3
71	""	901	94	42	5
72	Apr	1109	114	51	7
73	""	1284	127	57	6
74	""	1380	128	60	8
75	""	1488	129	68	6
76	05	1488	130	68	7
77	""	1488	129	68	7
78	""	1828	133	86	6
79	""	1956	121	98	7
80	""	1956	96	98	6
81	10	2349	138	118	8
82	""	2349	123	118	7
83	""	2620	162	126	9
84	""	2967	211	173	15
85	""	3167	192	177	13
86	15	3286	190	183	12
87	""	3614	236	189	13
88	""	3755	201	196	11
89	""	4126	254	200	12
90	""	4335	245	217	13
91	20	4680	245	226	7
92	""	4964	257	235	9
93	""	5044	251	245	8
94	""	5300	241	260	11
95	""	5543	255	265	9
96	25	5749	232	267	10
97	""	5926	227	273	8
98	""	6135	208	278	7
99	""	6293	190	282	7
100	""	6416	196	286	6
101	""	6652	193	293	5
102	May	6972	204	301	5
103	""	7288	220	313	6
104	""	7578	236	326	8
105	""	7954	260	333	8
106	05	8235	277	346	9
107	""	8480	295	354	10
108	""	8807	308	362	10
109	""	9095	303	373	10
110	""	9376	299	380	9
111	10	9882	329	385	9
112	""	10347	342	388	8
113	""	10634	342	393	6
114	""	10900	346	402	7
115	""	11196	341	409	7
116	15	11320	318	422	7
117	""	11739	338	424	6
118	""	12110	318	428	6
119	""	12314	281	428	6
120	""	12725	299	434	6
121	20	13223	332	441	6
122	""	13477	325	446	5
123	""	13657	334	448	4
124	""	13989	322	456	4
125	""	14422	330	458	4
126	25	14801	355	458	5
127	""	15073	336	460	3
128	""	15264	291	468	4
129	""	15723	321	474	4
130	""	16068	345	485	6
131	""	16531	363	488	4
132	""	16908	355	498	6
133	Jun	17285	355	502	6
134	""	17572	357	502	6
135	""	17752	355	515	7
136	""	18040	331	516	6
137	05	18319	322	520	5
138	""	18708	311	525	5
139	""	19195	326	536	6
140	""	19600	331	538	5
141	""	20126	365	539	5
142	10	20415	380	544	4
143	""	20808	396	550	5
144	""	21437	445	561	6
145	""	22008	472	568	6
146	""	22572	482	577	6
147	15	22962	480	592	8
148	""	23271	450	605	9
149	""	23686	467	615	10
150	""	24105	471	633	12
151	""	24645	458	635	11
152	20	25068	437	647	11
153	""	25778	458	655	11
154	""	26677	531	662	10
155	""	27370	586	669	9
156	""	27936	607	675	9
157	25	28631	646	691	8
158	""	29141	643	698	9
159	""	29764	671	712	9
160	""	30619	691	718	9
161	""	31373	671	726	9
162	""	31816	635	733	10
163	Jul	32568	662	747	10
164	""	33387	679	754	9
165	""	34197	723	765	9
166	""	35148	769	775	9
167	05	36184	795	786	10
168	""	37425	864	794	10
169	""	38128	902	804	10
170	""	38430	837	821	11
171	""	39588	886	829	10
172	10	40790	942	842	11
173	""	41915	967	864	13
174	""	43114	990	880	13
175	""	44532	1015	897	15
176	""	45506	1054	903	14
177	15	46305	1125	910	13
178	""	47671	1155	929	14
179	""	48743	1136	941	14
180	""	50113	1171	942	12
181	""	51519	1201	971	13
182	20	52855	1189	981	12
183	""	53956	1207	993	12
184	""	54797	1213	999	13
185	""	56043	1196	1005	11
186	""	57615	1268	1006	9
187	25	59077	1280	1036	14
188	""	60896	1340	1055	12
189	""	62908	1436	1063	11
190	""	64156	1457	1083	13
191	""	64690	1413	1101	15
192	""	66182	1449	1123	17
193	""	67915	1471	1146	20
194	Aug	69649	1510	1160	17
195	""	71415	1503	1170	17
196	""	72243	1334	1178	16
197	""	73117	1280	1183	15
198	05	74295	1372	1213	16
199	""	75660	1354	1222	14
200	""	76536	1232	1246	14
201	""	77709	1151	1259	14
202	""	78778	1052	1289	17
203	10	79732	1070	1309	19
204	""	80499	1054	1328	21
205	""	81094	972	1346	19
206	""	82224	937	1371	21
207	""	83134	943	1393	21
208	15	84488	968	1409	21
209	""	85545	967	1438	22
EOF

# confirmed:
set label "85545  " at first 209,855*175/875   left back textcolor "#8080ff"
# -~confirmed:
set label "967    " at first 209, 96           left back textcolor "#ff8080"
set label "1510   " at first 194,151        +2 left back textcolor "#ff8080"
# deaths:
set label "1438   " at first 209,143           left back textcolor "#ff8080"
# -~deaths:
set label "22     " at first 209, 22*175/875   left back textcolor "#8080ff"

set multiplot
  plot $data using 0:($3/    100*175/875) with lines lc 6 lw 8 dt 1 title at 0.150, 0.920
replot $data using 0:($4/     10        ) with lines lc 7 lw 8 dt 4 title at 0.150, 0.902
replot $data using 0:($5/     10        ) with lines lc 7 lw 5 dt 2 title at 0.150, 0.884
replot $data using 0:($6/      1*175/875) with lines lc 6 lw 5 dt 3 title at 0.150, 0.866

# plot hor axis calendar
replot $data using 0:(0):xticlabel(2) with lines
|
File history
Click on a date/time to view the file as it appeared at that time.
| Date/Time | Thumbnail | Dimensions | User | Comment | |
|---|---|---|---|---|---|
| current | 19:01, 24 September 2020 |  | 3,300 × 1,950 (25 KB) | Jochen Burghardt (talk | contribs) | =={{int:filedesc}}== {{Information |description={{en|1=Diagram of WHO COVID-19 daily data (20 Jan - 16 Aug 2020) for ''"Total Confirmed Cases"'' (thick solid line), its smoothed increment (thick dash-dotted line), ''"Total Deaths"'' (thin dashed line), and its smoothed increment (thin dotted line); see File:WHO_Covid_2020_Jan-Aug_daily_C_Afghanistan.pdf for details.}} |date=2020-09-24 |source={{own}} |author=Jochen Burghardt |permission= |other_versions=[[:File:... |
You cannot overwrite this file.
File usage on Commons
There are no pages that use this file.