File:WHO Covid 2020 Jan-Aug daily C Belgium.pdf
Jump to navigation
Jump to search

Size of this JPG preview of this PDF file: 800 × 473 pixels. Other resolutions: 320 × 189 pixels | 640 × 378 pixels | 1,024 × 605 pixels | 1,280 × 756 pixels | 3,300 × 1,950 pixels.
Original file (3,300 × 1,950 pixels, file size: 25 KB, MIME type: application/pdf)
Captions
Captions
Add a one-line explanation of what this file represents
Summary[edit]
| Description |
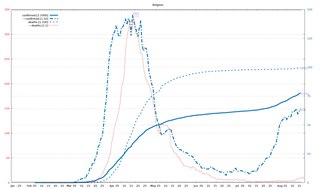
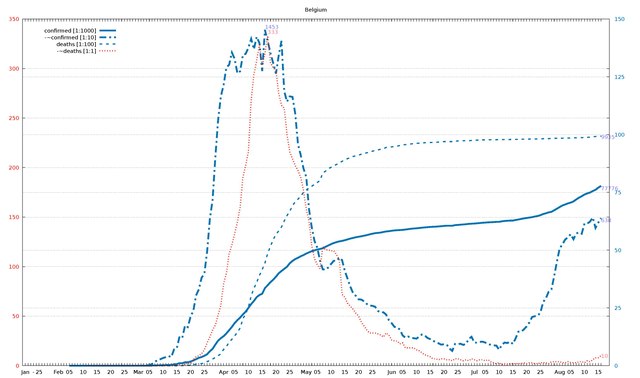
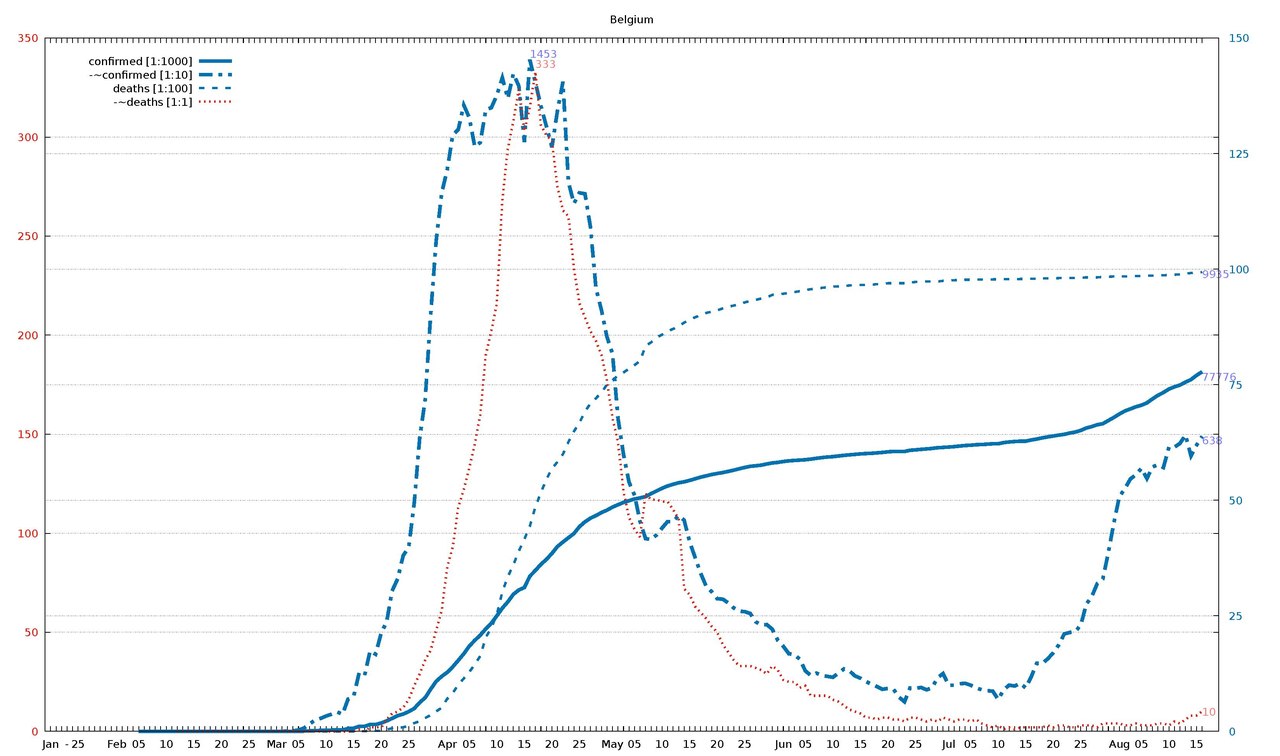
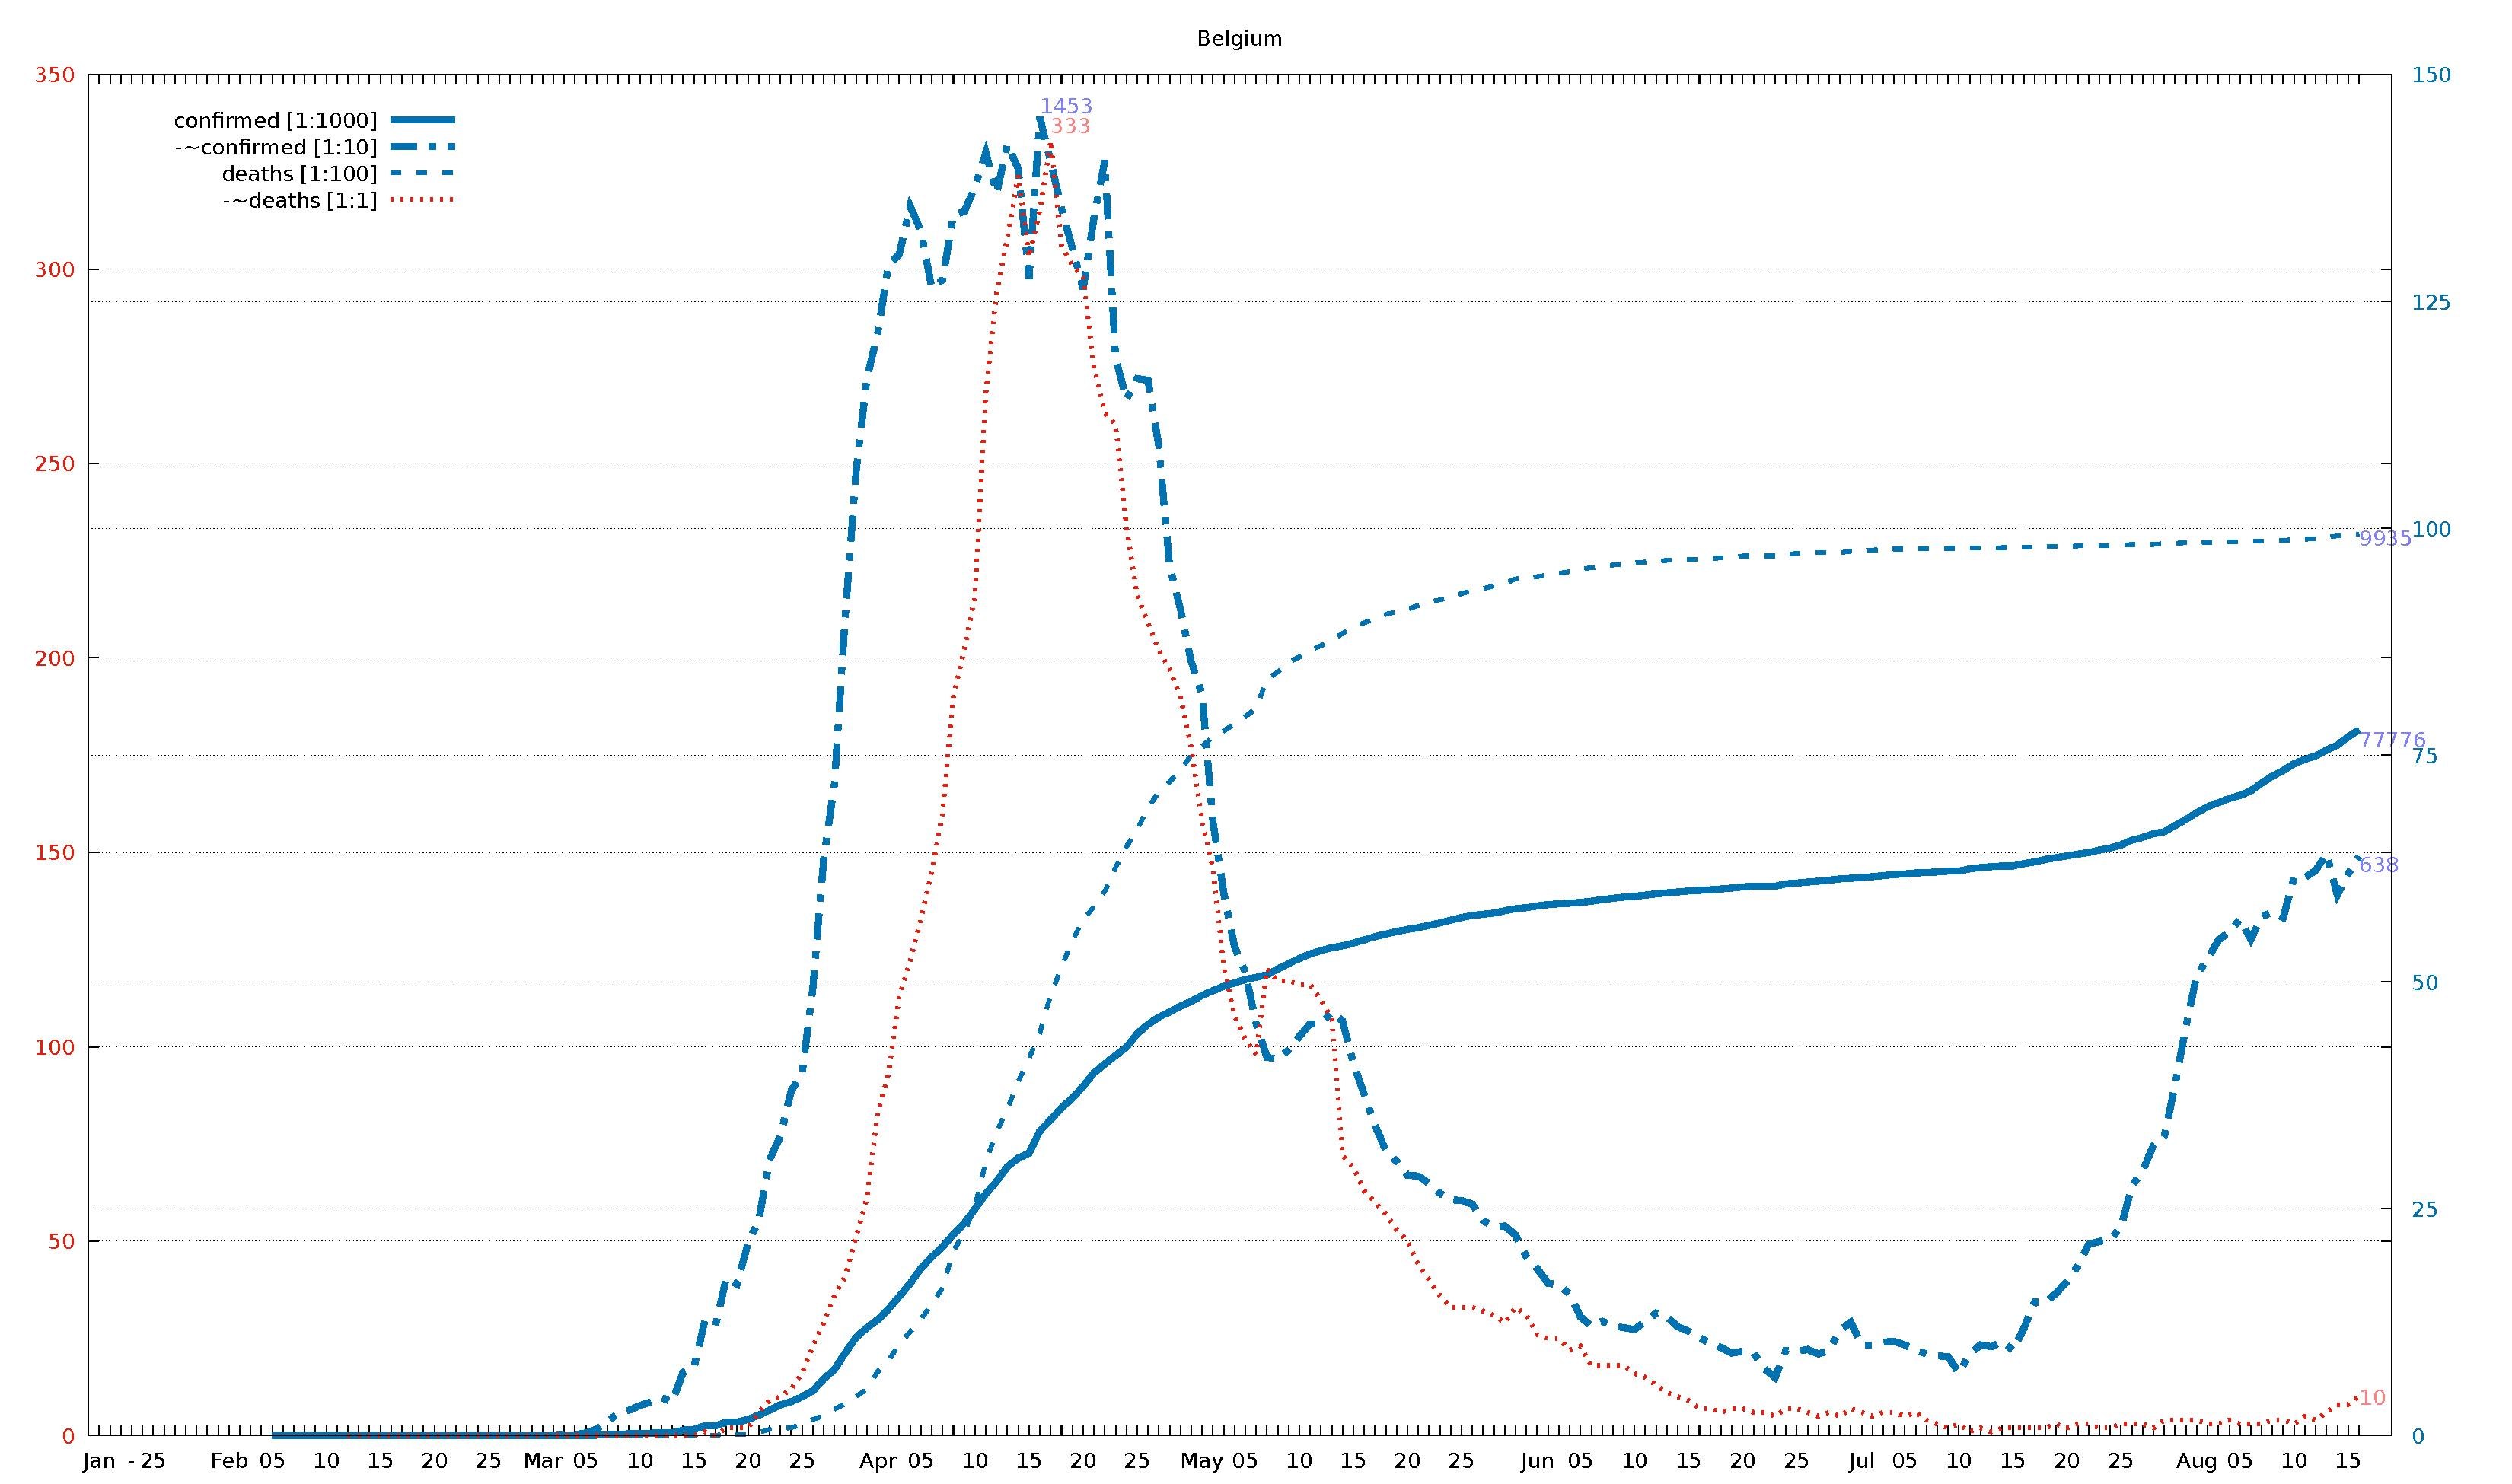
English: Diagram of WHO COVID-19 daily data (20 Jan - 16 Aug 2020) for "Total Confirmed Cases" (thick solid line), its smoothed increment (thick dash-dotted line), "Total Deaths" (thin dashed line) , and its smoothed increment (thin dotted line). Figures are taken from the available situation reports. Red and blue lines refer to the left and right vertical axis, respectively; the scaling factor for each curve is given in the legend. The horizontal axis starts on 20 Jan 2020 (situation report 1), and ends on 16 Aug 2020 (situation report 209). In the smoothed curves, for each day, 1/7 of the difference of the current day's figure and the figure a week ago is shown. For example, in situation report 115 (14 May 2020) and 121 (21 May 2020), there were 8676 and 5339 Total Confirmed Cases in Afghanistan, respectively, so the thick dash-dotted line passes through 477 = (8676-5339)/7 on 21 May.
For an overview of all related visualizations, and a more detailled description, see WHO Covid diagram set#Available country diagrams Jan-Aug 2020 (daily). |
| Date | |
| Source | Own work |
| Author | Jochen Burghardt |
Licensing[edit]
I, the copyright holder of this work, hereby publish it under the following license:
This file is licensed under the Creative Commons Attribution-Share Alike 4.0 International license.
- You are free:
- to share – to copy, distribute and transmit the work
- to remix – to adapt the work
- Under the following conditions:
- attribution – You must give appropriate credit, provide a link to the license, and indicate if changes were made. You may do so in any reasonable manner, but not in any way that suggests the licensor endorses you or your use.
- share alike – If you remix, transform, or build upon the material, you must distribute your contributions under the same or compatible license as the original.
Gnuplot source code[edit]
| Gnuplot source code |
|---|
set term pdf size 22,13
set term pdf font "sans,20"
set output "WHO_Covid_C_Belgium.pdf"
set key autotitle columnhead
set termoption noenhanced
# (1) norm: 778 146 994 333
# (2) dist: 1,0:187 2,0:128 2,1:146 3,0:234 3,1:228 3,2:299
# (3,4) dist max: 299 3:333--2:994
# (4) right: 1 1 1 0
# (6,7) scMax: 350 150
# (8) scale: [1:1000] [1:10] [1:100] [1:1]


set xrange [-1:212]
set yrange [0:350]
set y2range [0:150]
set xtics 3650,100
set ytics 50 textcolor "#e51e10"
set y2tics 25 textcolor "#0072b2"
set grid y y2

set title "Belgium"

$data <<EOF
rep day "confirmed [1:1000]" "-~confirmed [1:10]" "deaths [1:100]" "-~deaths [1:1]"
1	Jan	.	-	.	-
2	""	.	-	.	-
3	""	.	-	.	-
-	-	-	-	-	-
4	""	.	-	.	-
5	25	.	-	.	-
6	""	.	-	.	-
7	""	.	-	.	-
8	""	.	-	.	-
9	""	.	-	.	-
10	""	.	-	.	-
11	""	.	-	.	-
12	Feb	.	-	.	-
13	""	.	-	.	-
14	""	.	-	.	-
15	""	.	-	.	-
16	05	1	-	0	-
17	""	1	-	0	-
18	""	1	-	0	-
19	""	1	-	0	-
20	""	1	-	0	-
21	10	1	-	0	-
22	""	1	-	0	-
23	""	1	0	0	0
24	""	1	0	0	0
25	""	1	0	0	0
26	15	1	0	0	0
27	""	1	0	0	0
28	""	1	0	0	0
29	""	1	0	0	0
30	""	1	0	0	0
31	20	1	0	0	0
32	""	1	0	0	0
33	""	1	0	0	0
34	""	1	0	0	0
35	""	1	0	0	0
36	25	1	0	0	0
37	""	1	0	0	0
38	""	1	0	0	0
39	""	1	0	0	0
40	""	1	0	0	0
41	Mar	1	0	0	0
42	""	1	0	0	0
43	""	8	1	0	0
44	""	8	1	0	0
45	05	23	3	0	0
46	""	50	7	0	0
47	""	109	16	0	0
48	""	169	24	0	0
49	""	200	28	0	0
50	10	239	33	0	0
51	""	267	37	0	0
52	""	314	42	0	0
53	""	314	37	0	0
54	""	599	70	0	0
55	15	689	75	0	0
56	""	1085	126	5	1
57	""	1085	121	5	0
58	""	1486	174	14	2
59	""	1486	167	14	2
60	20	1795	212	14	2
61	""	2257	237	37	6
62	""	2815	304	67	9
63	""	3401	330	75	10
64	""	3743	380	88	12
65	25	4269	398	122	16
66	""	4937	493	178	23
67	""	6235	634	220	29
68	""	7284	718	289	36
69	""	9134	903	353	41
70	""	10836	1062	431	51
71	""	11899	1165	513	61
72	Apr	12775	1215	705	83
73	""	13964	1290	828	93
74	""	15348	1302	1011	113
75	""	16770	1355	1143	122
76	05	18431	1328	1283	133
77	""	19691	1265	1447	145
78	""	20814	1274	1632	160
79	""	22194	1345	2035	190
80	""	23403	1349	2240	202
81	10	24983	1376	2523	216
82	""	26667	1414	3019	268
83	""	28018	1369	3346	294
84	""	29647	1423	3600	308
85	""	30589	1396	3903	324
86	15	31119	1275	4157	303
87	""	33573	1453	4440	315
88	""	34809	1404	4857	333
89	""	36138	1353	5163	306
90	""	37183	1309	5453	301
91	20	38496	1264	5683	298
92	""	39983	1342	5828	275
93	""	40956	1405	5998	263
94	""	41889	1188	6262	260
95	""	42797	1142	6490	234
96	25	44293	1165	6679	216
97	""	45325	1163	6917	209
98	""	46134	1091	7094	202
99	""	46687	958	7207	197
100	""	47334	911	7331	190
101	""	47859	853	7501	177
102	May	48519	817	7594	158
103	""	49032	677	7703	146
104	""	49517	599	7765	121
105	""	49906	539	7844	108
106	05	50267	511	7924	102
107	""	50509	454	8016	98
108	""	50781	417	8339	120
109	""	51420	415	8415	117
110	""	52011	425	8521	117
111	10	52596	440	8581	116
112	""	53081	454	8656	116
113	""	53449	454	8707	112
114	""	53779	467	8761	107
115	""	53981	457	8843	72
116	15	54288	410	8903	69
117	""	54644	376	8959	63
118	""	54989	342	9005	60
119	""	55280	314	9052	57
120	""	55559	302	9080	53
121	20	55791	287	9108	50
122	""	55983	286	9150	44
123	""	56235	278	9186	40
124	""	56511	267	9212	36
125	""	56810	260	9237	33
126	25	57092	259	9280	33
127	""	57342	255	9312	33
128	""	57455	237	9334	32
129	""	57592	230	9364	31
130	""	57849	231	9388	29
131	""	58061	221	9443	33
132	""	58186	197	9453	31
133	Jun	58381	184	9467	26
134	""	58517	168	9486	25
135	""	58615	166	9505	25
136	""	58685	156	9522	22
137	05	58767	131	9548	23
138	""	58907	121	9566	18
139	""	59072	126	9580	18
140	""	59226	121	9595	18
141	""	59348	119	9609	18
142	10	59437	117	9619	16
143	""	59569	126	9629	15
144	""	59711	135	9636	13
145	""	59819	131	9646	11
146	""	59918	120	9650	10
147	15	60029	115	9655	9
148	""	60100	108	9661	7
149	""	60155	102	9663	7
150	""	60244	97	9675	6
151	""	60348	91	9683	7
152	20	60476	93	9695	7
153	""	60550	91	9696	6
154	""	60550	74	9696	6
155	""	60550	64	9696	5
156	""	60810	94	9713	7
157	25	60898	93	9722	7
158	""	61007	95	9726	6
159	""	61106	90	9731	5
160	""	61209	94	9732	6
161	""	61361	116	9732	5
162	""	61427	125	9747	7
163	Jul	61509	100	9754	6
164	""	61598	100	9761	5
165	""	61727	103	9765	6
166	""	61838	104	9771	6
167	05	61909	100	9771	5
168	""	62016	94	9771	6
169	""	62058	90	9774	4
170	""	62123	88	9776	3
171	""	62210	87	9778	2
172	10	62210	69	9781	3
173	""	62469	90	9782	1
174	""	62606	100	9782	2
175	""	62707	98	9782	1
176	""	62781	104	9787	2
177	15	62781	94	9787	2
178	""	63039	118	9792	2
179	""	63238	147	9795	2
180	""	63499	147	9800	2
181	""	63706	157	9800	3
182	20	63893	170	9800	2
183	""	64094	187	9805	3
184	""	64258	211	9805	3
185	""	64534	214	9808	2
186	""	64754	216	9812	2
187	25	65106	230	9817	3
188	""	65634	275	9821	3
189	""	65933	292	9821	3
190	""	66335	320	9822	2
191	""	66569	330	9833	4
192	""	67242	387	9836	4
193	""	67913	451	9840	4
194	Aug	68658	508	9841	4
195	""	69309	525	9845	3
196	""	69756	546	9845	3
197	""	70221	555	9850	4
198	05	70555	569	9852	3
199	""	71065	547	9859	3
200	""	71923	572	9861	3
201	""	72691	577	9866	4
202	""	73308	571	9870	4
203	10	74059	615	9872	3
204	""	74527	615	9879	5
205	""	74915	623	9885	4
206	""	75554	641	9900	6
207	""	76098	596	9916	8
208	15	77020	619	9924	8
209	""	77776	638	9935	10
EOF

# confirmed:
set label "77776  " at first 209, 77*350/150   left back textcolor "#8080ff"
# -~confirmed:
set label "638    " at first 209, 63*350/150   left back textcolor "#8080ff"
set label "1453   " at first  87,145*350/150+4 left back textcolor "#8080ff"
# deaths:
set label "9935   " at first 209, 99*350/150   left back textcolor "#8080ff"
# -~deaths:
set label "10     " at first 209, 10           left back textcolor "#ff8080"
set label "333    " at first  88,333        +4 left back textcolor "#ff8080"

set multiplot
  plot $data using 0:($3/   1000*350/150) with lines lc 6 lw 8 dt 1 title at 0.150, 0.920
replot $data using 0:($4/     10*350/150) with lines lc 6 lw 8 dt 4 title at 0.150, 0.902
replot $data using 0:($5/    100*350/150) with lines lc 6 lw 5 dt 2 title at 0.150, 0.884
replot $data using 0:($6/      1        ) with lines lc 7 lw 5 dt 3 title at 0.150, 0.866

# plot hor axis calendar
replot $data using 0:(0):xticlabel(2) with lines
|
File history
Click on a date/time to view the file as it appeared at that time.
| Date/Time | Thumbnail | Dimensions | User | Comment | |
|---|---|---|---|---|---|
| current | 18:50, 24 September 2020 |  | 3,300 × 1,950 (25 KB) | Jochen Burghardt (talk | contribs) | =={{int:filedesc}}== {{Information |description={{en|1=Diagram of WHO COVID-19 daily data (20 Jan - 16 Aug 2020) for ''"Total Confirmed Cases"'' (thick solid line), its smoothed increment (thick dash-dotted line), ''"Total Deaths"'' (thin dashed line), and its smoothed increment (thin dotted line); see File:WHO_Covid_2020_Jan-Aug_daily_C_Afghanistan.pdf for details.}} |date=2020-09-24 |source={{own}} |author=Jochen Burghardt |permission= |other_versions=[[:File:... |
You cannot overwrite this file.
File usage on Commons
There are no pages that use this file.