File:WHO Covid 2020 Jan-Aug daily C Armenia.pdf
Jump to navigation
Jump to search

Size of this JPG preview of this PDF file: 800 × 473 pixels. Other resolutions: 320 × 189 pixels | 640 × 378 pixels | 1,024 × 605 pixels | 1,280 × 756 pixels | 3,300 × 1,950 pixels.
Original file (3,300 × 1,950 pixels, file size: 24 KB, MIME type: application/pdf)
Captions
Captions
Add a one-line explanation of what this file represents
Summary[edit]
| Description |
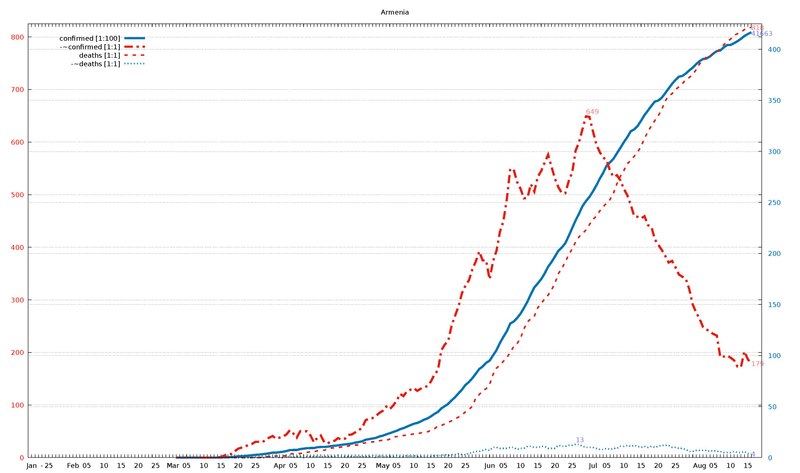
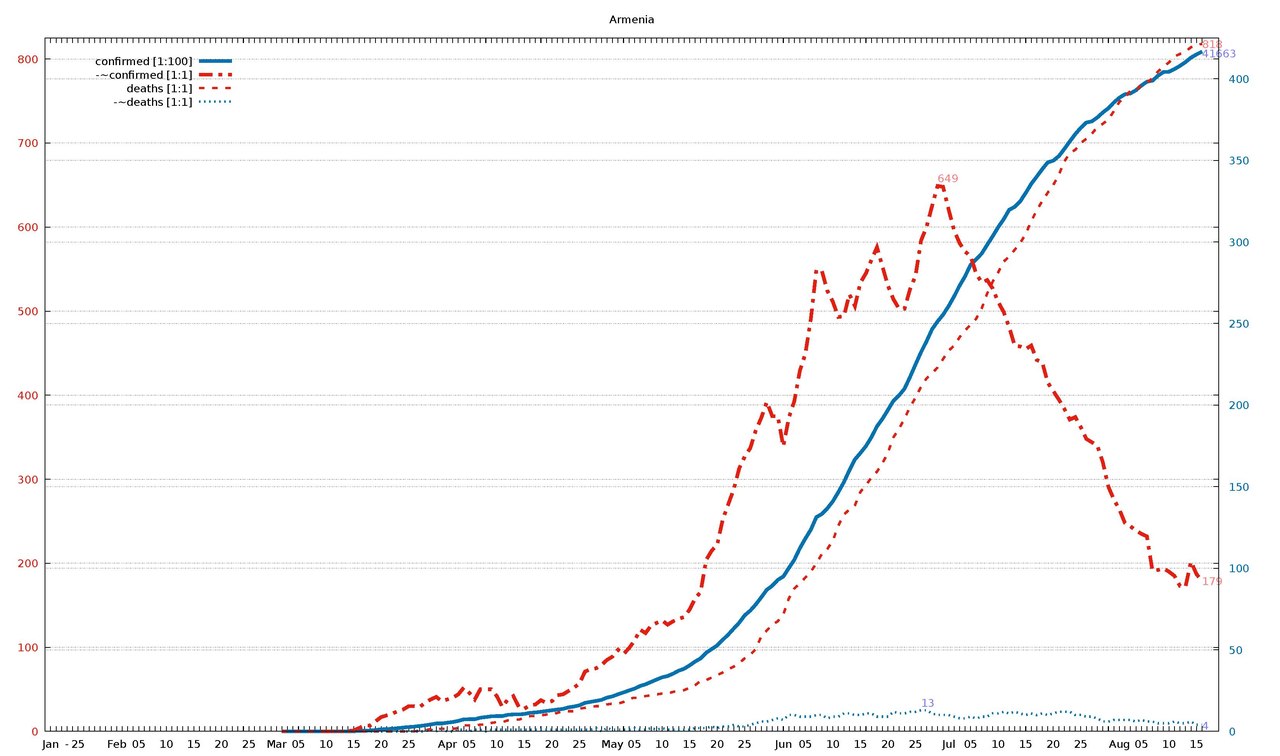
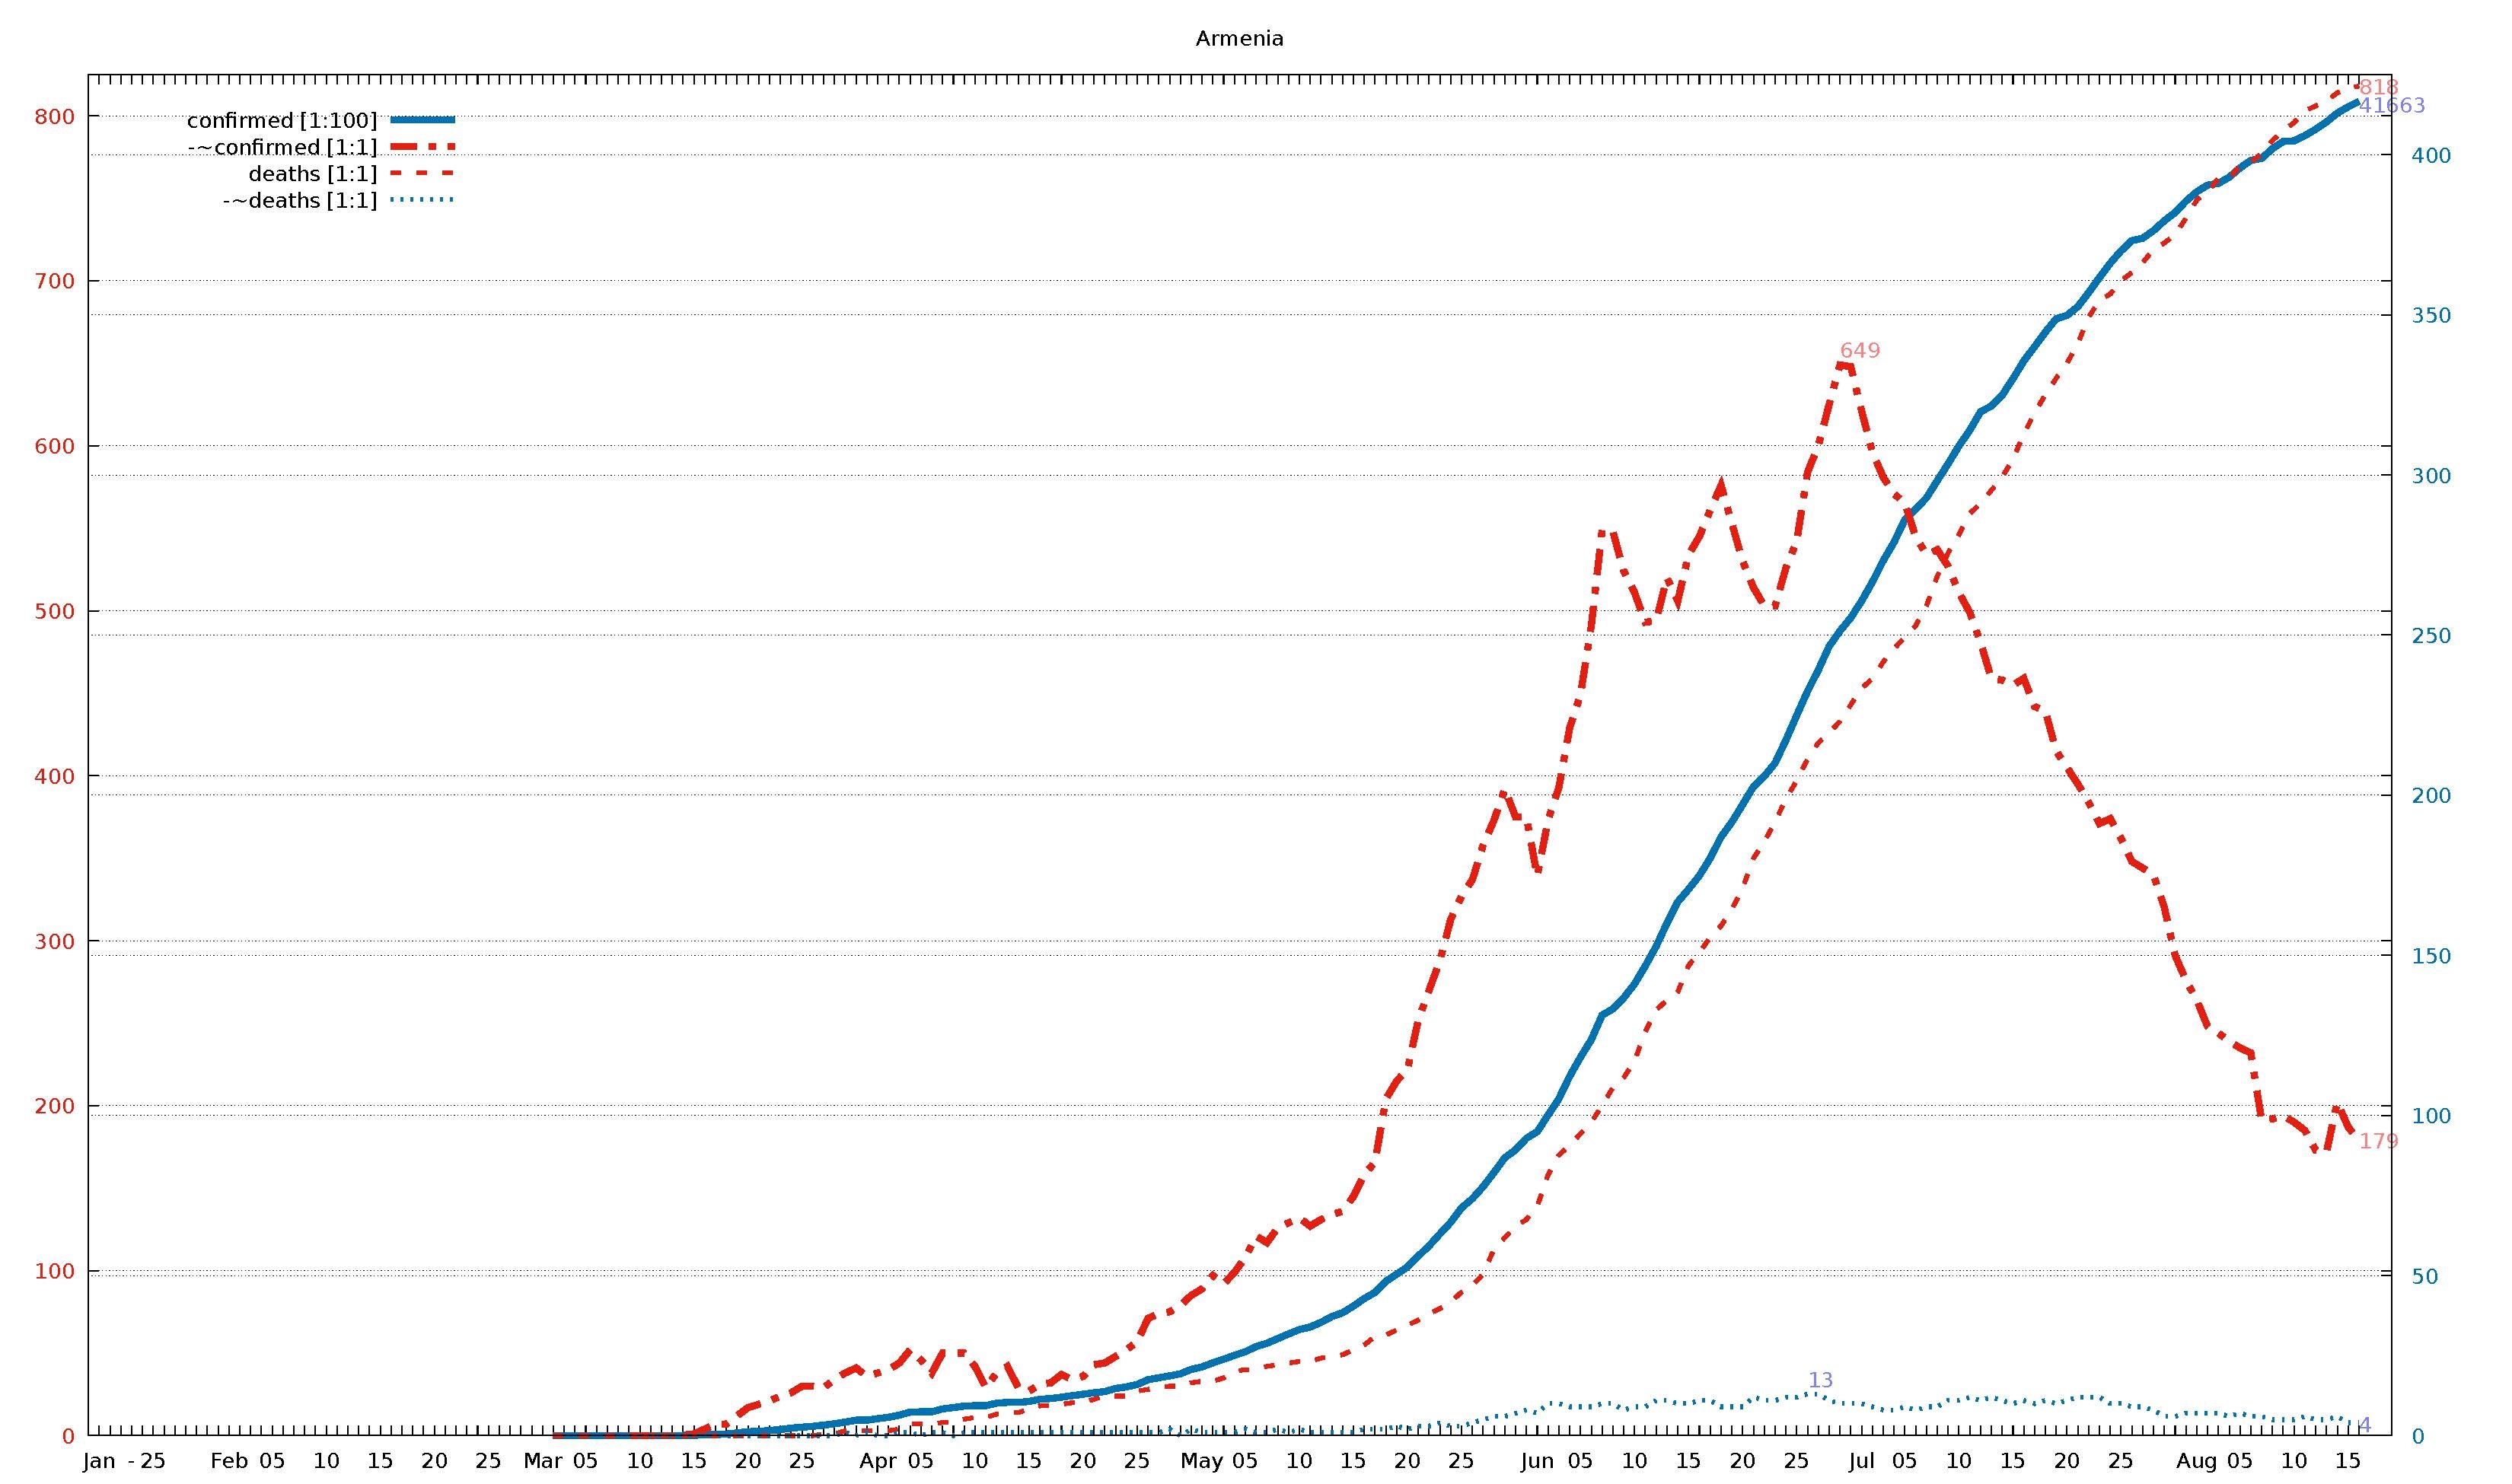
English: Diagram of WHO COVID-19 daily data (20 Jan - 16 Aug 2020) for "Total Confirmed Cases" (thick solid line), its smoothed increment (thick dash-dotted line), "Total Deaths" (thin dashed line) , and its smoothed increment (thin dotted line). Figures are taken from the available situation reports. Red and blue lines refer to the left and right vertical axis, respectively; the scaling factor for each curve is given in the legend. The horizontal axis starts on 20 Jan 2020 (situation report 1), and ends on 16 Aug 2020 (situation report 209). In the smoothed curves, for each day, 1/7 of the difference of the current day's figure and the figure a week ago is shown. For example, in situation report 115 (14 May 2020) and 121 (21 May 2020), there were 8676 and 5339 Total Confirmed Cases in Afghanistan, respectively, so the thick dash-dotted line passes through 477 = (8676-5339)/7 on 21 May.
For an overview of all related visualizations, and a more detailled description, see WHO Covid diagram set#Available country diagrams Jan-Aug 2020 (daily). |
| Date | |
| Source | Own work |
| Author | Jochen Burghardt |
Licensing[edit]
I, the copyright holder of this work, hereby publish it under the following license:
This file is licensed under the Creative Commons Attribution-Share Alike 4.0 International license.
- You are free:
- to share – to copy, distribute and transmit the work
- to remix – to adapt the work
- Under the following conditions:
- attribution – You must give appropriate credit, provide a link to the license, and indicate if changes were made. You may do so in any reasonable manner, but not in any way that suggests the licensor endorses you or your use.
- share alike – If you remix, transform, or build upon the material, you must distribute your contributions under the same or compatible license as the original.
Gnuplot source code[edit]
| Gnuplot source code |
|---|
set term pdf size 22,13
set term pdf font "sans,20"
set output "WHO_Covid_C_Armenia.pdf"
set key autotitle columnhead
set termoption noenhanced
# (1) norm: 417 649 818 001
# (2) dist: 1,0:156 2,0:197 2,1:126
# (3,4) dist max: 197 2:818--0:417
# (4) right: 1 0 0 1
# (6,7) scMax: 825 425
# (8) scale: [1:100] [1:1] [1:1] [1:1]


set xrange [-1:212]
set yrange [0:825]
set y2range [0:425]
set xtics 3650,100
set ytics 100 textcolor "#e51e10"
set y2tics 50 textcolor "#0072b2"
set grid y y2

set title "Armenia"

$data <<EOF
rep day "confirmed [1:100]" "-~confirmed [1:1]" "deaths [1:1]" "-~deaths [1:1]"
1	Jan	.	-	.	-
2	""	.	-	.	-
3	""	.	-	.	-
-	-	-	-	-	-
4	""	.	-	.	-
5	25	.	-	.	-
6	""	.	-	.	-
7	""	.	-	.	-
8	""	.	-	.	-
9	""	.	-	.	-
10	""	.	-	.	-
11	""	.	-	.	-
12	Feb	.	-	.	-
13	""	.	-	.	-
14	""	.	-	.	-
15	""	.	-	.	-
16	05	.	-	.	-
17	""	.	-	.	-
18	""	.	-	.	-
19	""	.	-	.	-
20	""	.	-	.	-
21	10	.	-	.	-
22	""	.	-	.	-
23	""	.	-	.	-
24	""	.	-	.	-
25	""	.	-	.	-
26	15	.	-	.	-
27	""	.	-	.	-
28	""	.	-	.	-
29	""	.	-	.	-
30	""	.	-	.	-
31	20	.	-	.	-
32	""	.	-	.	-
33	""	.	-	.	-
34	""	.	-	.	-
35	""	.	-	.	-
36	25	.	-	.	-
37	""	.	-	.	-
38	""	.	-	.	-
39	""	.	-	.	-
40	""	.	-	.	-
41	Mar	.	-	.	-
42	""	1	-	0	-
43	""	1	-	0	-
44	""	1	-	0	-
45	05	1	-	0	-
46	""	1	-	0	-
47	""	1	-	0	-
48	""	1	-	0	-
49	""	1	0	0	0
50	10	1	0	0	0
51	""	1	0	0	0
52	""	1	0	0	0
53	""	1	0	0	0
54	""	8	1	0	0
55	15	8	1	0	0
56	""	26	4	0	0
57	""	52	7	0	0
58	""	52	7	0	0
59	""	84	12	0	0
60	20	122	17	0	0
61	""	136	19	0	0
62	""	160	21	0	0
63	""	190	24	0	0
64	""	235	26	0	0
65	25	265	30	0	0
66	""	290	30	0	0
67	""	329	29	1	0
68	""	372	34	1	0
69	""	424	38	3	1
70	""	482	41	3	0
71	""	482	36	3	1
72	Apr	532	38	3	0
73	""	571	40	3	0
74	""	640	44	4	1
75	""	736	52	7	1
76	05	746	46	7	0
77	""	746	38	7	1
78	""	833	50	8	1
79	""	877	50	8	0
80	""	921	50	10	1
81	10	937	42	11	1
82	""	937	29	11	1
83	""	1013	38	13	1
84	""	1039	42	14	1
85	""	1039	29	14	1
86	15	1067	27	16	1
87	""	1135	31	18	1
88	""	1159	32	18	1
89	""	1201	37	19	1
90	""	1248	34	20	1
91	20	1291	36	20	1
92	""	1339	43	22	1
93	""	1377	44	24	1
94	""	1473	48	24	1
95	""	1523	52	24	1
96	25	1596	57	27	1
97	""	1746	71	28	1
98	""	1808	74	29	1
99	""	1867	75	30	2
100	""	1932	79	30	0
101	""	2066	85	32	2
102	May	2148	89	33	1
103	""	2273	97	33	1
104	""	2386	92	35	1
105	""	2507	99	39	1
106	05	2619	108	40	2
107	""	2782	121	40	1
108	""	2884	117	42	1
109	""	3029	126	43	2
110	""	3175	129	44	1
111	10	3313	132	45	2
112	""	3392	127	45	1
113	""	3538	131	47	1
114	""	3718	134	48	1
115	""	3836	136	49	1
116	15	4044	145	52	1
117	""	4283	158	55	2
118	""	4472	166	60	2
119	""	4823	204	61	2
120	""	5041	215	64	3
121	20	5271	222	67	2
122	""	5606	252	70	3
123	""	5928	270	74	3
124	""	6302	288	77	4
125	""	6661	313	81	3
126	25	7113	327	87	3
127	""	7402	337	91	4
128	""	7774	358	98	5
129	""	8216	373	113	6
130	""	8676	392	120	6
131	""	8927	375	127	7
132	""	9282	375	131	8
133	Jun	9492	339	139	7
134	""	10009	373	158	10
135	""	10524	393	170	10
136	""	11221	429	176	9
137	05	11817	449	183	9
138	""	12364	491	190	9
139	""	13130	549	200	10
140	""	13325	548	211	10
141	""	13675	524	217	8
142	10	14103	511	227	9
143	""	14669	493	245	9
144	""	15281	494	258	11
145	""	16004	520	264	11
146	""	16667	506	269	10
147	15	17064	534	285	10
148	""	17489	545	293	11
149	""	18033	561	302	11
150	""	18698	576	309	9
151	""	19157	553	319	9
152	20	19708	530	332	9
153	""	20268	514	350	12
154	""	20588	503	360	11
155	""	21006	503	372	11
156	""	21717	526	386	12
157	25	22488	542	397	12
158	""	23247	584	410	13
159	""	23909	600	420	13
160	""	24645	625	426	11
161	""	25127	649	433	10
162	""	25542	648	443	10
163	Jul	26065	621	453	10
164	""	26658	596	459	9
165	""	27320	581	469	8
166	""	27900	571	477	8
167	05	28606	565	484	9
168	""	28936	545	491	8
169	""	29285	534	503	9
170	""	29820	537	521	9
171	""	30346	527	535	11
172	10	30903	511	546	11
173	""	31392	499	559	12
174	""	31969	481	565	11
175	""	32151	459	573	12
176	""	32490	458	581	11
177	15	33005	455	592	10
178	""	33559	459	607	11
179	""	34001	442	620	10
180	""	34462	439	631	11
181	""	34877	415	641	10
182	20	34981	405	650	11
183	""	35254	395	662	12
184	""	35693	384	678	12
185	""	36162	371	688	12
186	""	36613	374	692	10
187	25	36996	362	700	10
188	""	37317	348	705	9
189	""	37390	344	711	9
190	""	37629	340	719	8
191	""	37937	320	723	6
192	""	38196	291	728	6
193	""	38550	276	738	7
194	Aug	38841	264	749	7
195	""	39050	248	754	7
196	""	39102	244	762	7
197	""	39298	239	762	6
198	05	39586	235	770	7
199	""	39819	232	772	6
200	""	39885	191	777	6
201	""	40185	192	785	5
202	""	40410	194	791	5
203	10	40433	190	796	5
204	""	40593	185	803	6
205	""	40794	173	806	5
206	""	41023	172	809	5
207	""	41299	202	814	6
208	15	41495	187	817	4
209	""	41663	179	818	4
EOF

# confirmed:
set label "41663  " at first 209,416*825/425   left back textcolor "#8080ff"
# -~confirmed:
set label "179    " at first 209,179           left back textcolor "#ff8080"
set label "649    " at first 161,649        +9 left back textcolor "#ff8080"
# deaths:
set label "818    " at first 209,818           left back textcolor "#ff8080"
# -~deaths:
set label "4      " at first 209,  4*825/425   left back textcolor "#8080ff"
set label "13     " at first 158, 13*825/425+9 left back textcolor "#8080ff"

set multiplot
  plot $data using 0:($3/    100*825/425) with lines lc 6 lw 8 dt 1 title at 0.150, 0.920
replot $data using 0:($4/      1        ) with lines lc 7 lw 8 dt 4 title at 0.150, 0.902
replot $data using 0:($5/      1        ) with lines lc 7 lw 5 dt 2 title at 0.150, 0.884
replot $data using 0:($6/      1*825/425) with lines lc 6 lw 5 dt 3 title at 0.150, 0.866

# plot hor axis calendar
replot $data using 0:(0):xticlabel(2) with lines
|
File history
Click on a date/time to view the file as it appeared at that time.
| Date/Time | Thumbnail | Dimensions | User | Comment | |
|---|---|---|---|---|---|
| current | 18:47, 24 September 2020 |  | 3,300 × 1,950 (24 KB) | Jochen Burghardt (talk | contribs) | =={{int:filedesc}}== {{Information |description={{en|1=Diagram of WHO COVID-19 daily data (20 Jan - 16 Aug 2020) for ''"Total Confirmed Cases"'' (thick solid line), its smoothed increment (thick dash-dotted line), ''"Total Deaths"'' (thin dashed line), and its smoothed increment (thin dotted line); see File:WHO_Covid_2020_Jan-Aug_daily_C_Afghanistan.pdf for details.}} |date=2020-09-24 |source={{own}} |author=Jochen Burghardt |permission= |other_versions=[[:File:... |
You cannot overwrite this file.
File usage on Commons
There are no pages that use this file.