File:Volume-Tracking-A-new-method-for-quantitative-assessment-and-visualization-of-intracardiac-blood-1471-2342-11-10-S2.ogv
Jump to navigation
Jump to search
Size of this JPG preview of this OGG file: 564 × 600 pixels. Other resolutions: 226 × 240 pixels | 451 × 480 pixels | 768 × 817 pixels.
Original file (Ogg Theora video file, length 6.2 s, 768 × 817 pixels, 1.68 Mbps, file size: 1.24 MB)
Captions
Captions
Add a one-line explanation of what this file represents
Summary[edit]
| Description |
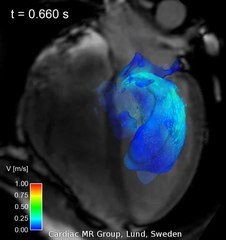
English: Animation: Composite visualization of LV filling using both Volume Tracking and particle tracing. Composite particle trace and Volume Tracking visualization of LV filling in volunteer 7, also shown in Figure 1. Anatomical four-chamber Cine images are displayed in the background for orientation. See Figure 1 for a description of the anatomy. The image is semi-transparent to show flow behind the four-chamber plane. Time is counted from the start of ventricular systole. At the beginning of the movie a Volume Tracking plane is visible at the level of the mitral valve, and a collection of particles are visible just above the plane. Particles are released every 20 milliseconds in the same location. The Volume Tracking plane can be seen as an infinitely flexible and stretchable sheet, deformed effortlessly with the flow. Between t = 0.337 s and t = 0.5 s, the Volume Tracking plane is deformed as blood flows into the ventricle. The particles show an ordered inflow. The Volume Tracking plane shows that the front of inflowing blood moves quickly towards the apex. After t = 0.5 s the particle traces show a complex arrangement of vortices, which slows down almost to a standstill around t = 0.8 s. The Volume Tracking surface keeps on deforming slowly even after t = 0.8s, when the particles seem to have stopped moving. Notice the correspondence between the two methods. Specifically, very few particles cross through the Volume Tracking plane. This is due to the fact that all particles are released in the inflowing blood and that the Volume Tracking plane separates the inflowing blood from the blood already in the ventricle. |
||
| Date | |||
| Source | Töger J, Carlsson M, Söderlind G, Arheden H, Heiberg E (2011). "Volume Tracking: A new method for quantitative assessment and visualization of intracardiac blood flow from three-dimensional, time-resolved, three-component magnetic resonance velocity mapping". BMC Medical Imaging. DOI:10.1186/1471-2342-11-10. PMID 21486430. PMC: 3102625. | ||
| Author | Töger J, Carlsson M, Söderlind G, Arheden H, Heiberg E | ||
| Permission (Reusing this file) |
This file is licensed under the Creative Commons Attribution 2.0 Generic license.
|
||
| Provenance |
|
File history
Click on a date/time to view the file as it appeared at that time.
| Date/Time | Thumbnail | Dimensions | User | Comment | |
|---|---|---|---|---|---|
| current | 18:12, 6 December 2012 | 6.2 s, 768 × 817 (1.24 MB) | Open Access Media Importer Bot (talk | contribs) | Automatically uploaded media file from Open Access source. Please report problems or suggestions here. |
You cannot overwrite this file.
File usage on Commons
There are no pages that use this file.