File:Spectral views of zero-fill and interpolation by lowpass filtering.pdf
Jump to navigation
Jump to search

Size of this JPG preview of this PDF file: 680 × 600 pixels. Other resolutions: 272 × 240 pixels | 544 × 480 pixels | 871 × 768 pixels | 1,161 × 1,024 pixels | 1,743 × 1,537 pixels.
Original file (1,743 × 1,537 pixels, file size: 101 KB, MIME type: application/pdf)
Captions
Captions
Add a one-line explanation of what this file represents
Summary[edit]
| Description |
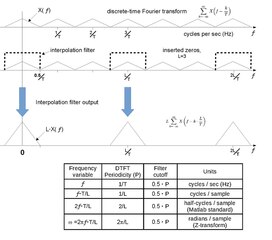
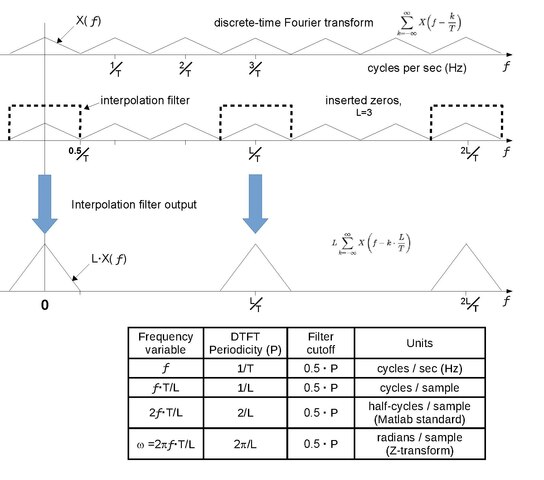
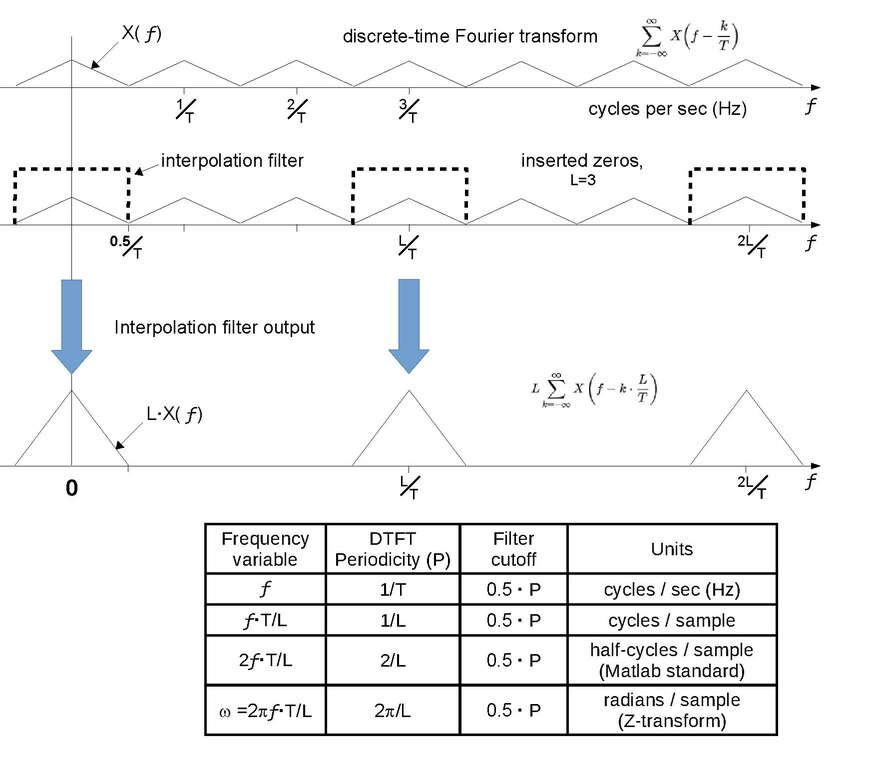
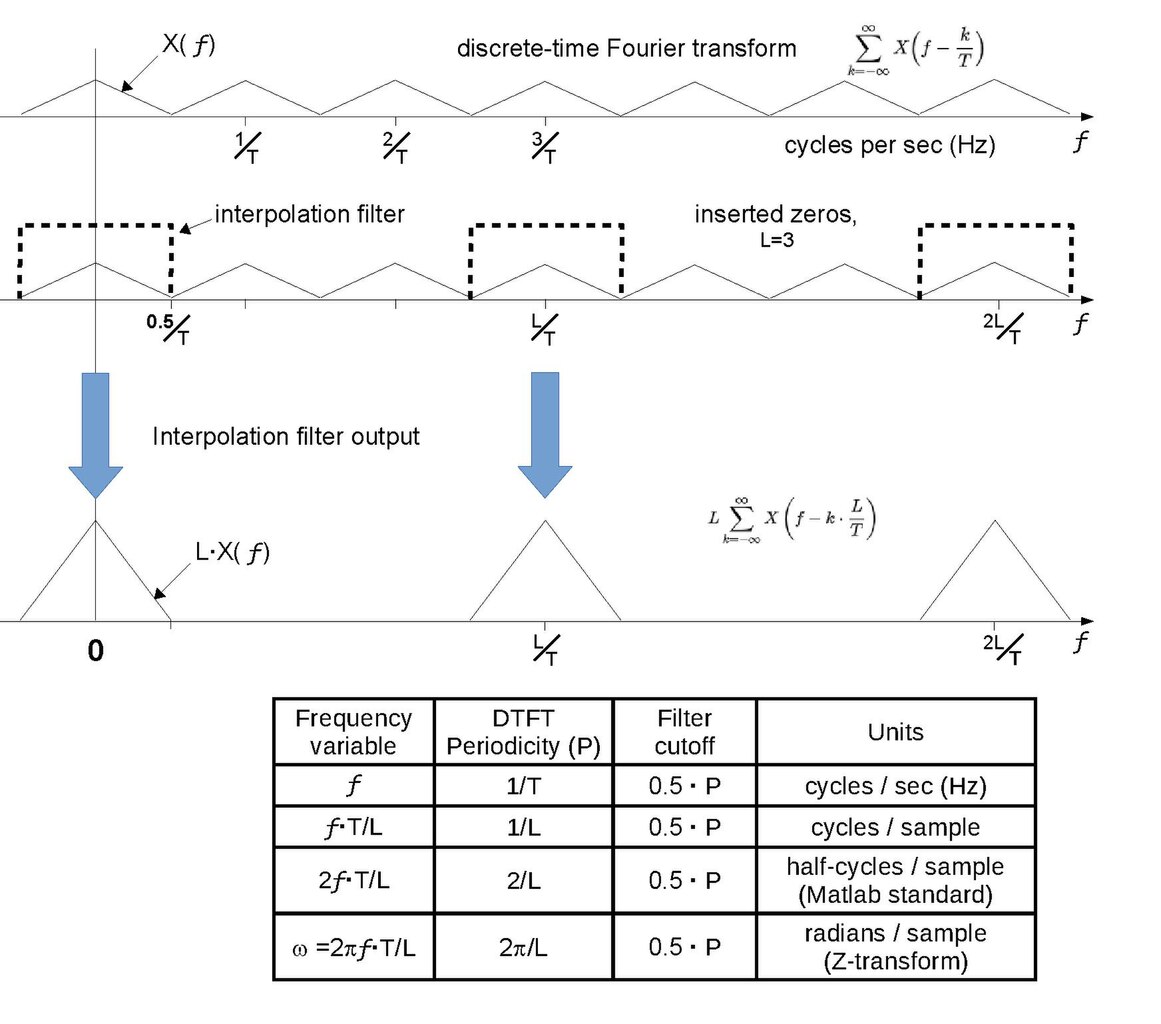
English: The first and third graphs depict the discrete-time Fourier transforms of a sampled function and the same function sampled 3 times faster. The second graph shows the transform of a sequence derived from the low-rate samples by inserting 2 zeros in-between each pair of real samples. It is identical to the first graph, except the numeral 3 is replaced by symbol L. A lowpass filter with bandwidth 0.5/T is also depicted. When applied to the zero-inserted sequence, its spectral output resembles the third graph, which is the desired result of interpolation. The maximum filter bandwidth is tabulated in the bandwidth units used by the common filter design applications. |
|||
| Date | ||||
| Source | Own work. The first and second graphs correspond to the first and third graphs of Harris[1], Figure 2.12, except the upsample rates are different (3 and 5) | |||
| Author | Bob K | |||
| Permission (Reusing this file) |
I, the copyright holder of this work, hereby publish it under the following license:
|
|||
| Other versions |
Derivative works of this file: Spectral views of zero-fill and interpolation by lowpass filtering.svg The current svg file renders the rectangular lowpass filter incorrectly. It should be a dashed line, not a solid line.
|
|||
| References |
|


File history
Click on a date/time to view the file as it appeared at that time.
| Date/Time | Thumbnail | Dimensions | User | Comment | |
|---|---|---|---|---|---|
| current | 20:12, 25 March 2024 |  | 1,743 × 1,537 (101 KB) | Bob K (talk | contribs) | Remove accidental (blank) second page. |
| 23:08, 24 March 2024 | 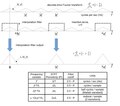 | 1,743 × 1,537, 2 pages (101 KB) | Bob K (talk | contribs) | Changed a label and a column header in the table. | |
| 15:22, 5 January 2020 | 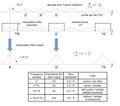 | 1,743 × 1,537 (69 KB) | Bob K (talk | contribs) | same frequency scale for all 3 graphs | |
| 15:50, 3 January 2020 | 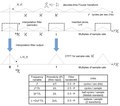 | 1,743 × 1,537 (67 KB) | Bob K (talk | contribs) | minor improvements | |
| 02:51, 3 January 2020 | 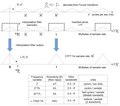 | 1,743 × 1,537 (67 KB) | Bob K (talk | contribs) | modify the table | |
| 02:51, 31 December 2019 | 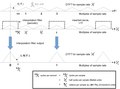 | 1,743 × 1,289 (54 KB) | Bob K (talk | contribs) | replace Z-transform graphs with table showing various units of bandwidth | |
| 23:49, 20 January 2014 | 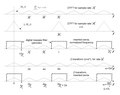 | 1,800 × 1,425 (36 KB) | Bob K (talk | contribs) | Remove accidental (blank) second page. | |
| 23:37, 20 January 2014 |  | 1,800 × 1,425, 2 pages (37 KB) | Bob K (talk | contribs) | User created page with UploadWizard |
You cannot overwrite this file.
File usage on Commons
The following 2 pages use this file:
File usage on other wikis
The following other wikis use this file:
- Usage on en.wikipedia.org
- Usage on zh.wikipedia.org