File:Sampled signal DFT frequency aliasing.pdf
Jump to navigation
Jump to search

Size of this JPG preview of this PDF file: 800 × 591 pixels. Other resolutions: 320 × 236 pixels | 640 × 473 pixels | 1,024 × 756 pixels | 1,162 × 858 pixels.
Original file (1,162 × 858 pixels, file size: 28 KB, MIME type: application/pdf)
Captions
Captions
Add a one-line explanation of what this file represents
| Description |
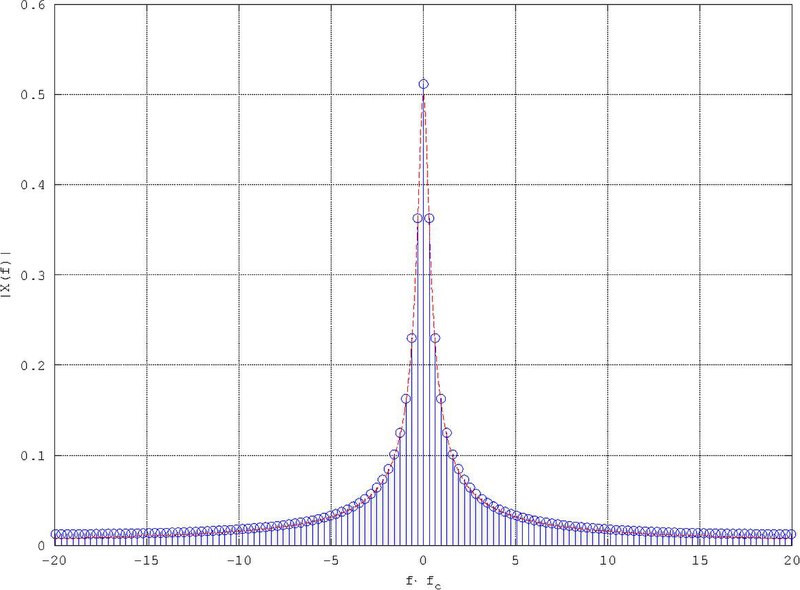
English: Example of aliasing in frequency (visible especially at the edges), due to too low sampling rate , of a sampled analogue signal.
Italiano: Esempio di aliasing in frequenza (visibile soprattutto agli estremi), dovuto a frequenza di campionamento troppo bassa, di un segnale analogico campionato. |
||
| Date | |||
| Source | Own work | ||
| Author | Luca Ghio | ||
| Permission (Reusing this file) |
|
||
| gnuplot source | click to expand
fc=40.52;
N=128;
Tc=1/fc;
T0=N*Tc;
Df=1/T0;
n=[0:N-1];
x_samp=exp(-2*n*Tc);
f=[-N/2:N/2-1]*Df;
DFT=fftshift(fft(x_samp,N));
figure
set (gca,'FontSize',14)
stem(f,abs(DFT)*Tc)
xlabel('f\cdot f_c')
ylabel('|X(f)|')
axis([-20 20 0 0.6])
grid on
hold on
f=[-N/2:0.01:N/2-1]*Df;
X=abs(1./(2+j*2*pi*f));
plot(f,X,'r--')
|

File history
Click on a date/time to view the file as it appeared at that time.
| Date/Time | Thumbnail | Dimensions | User | Comment | |
|---|---|---|---|---|---|
| current | 21:20, 22 January 2017 |  | 1,162 × 858 (28 KB) | Luca Ghio (talk | contribs) | {{Information |Description= {{en|Example of aliasing in frequency (visible especially at the edges), due to too low sampling rate <math>f_c</math>, of a sampled analogue signal.}} {{it|Esempio di aliasing in frequenza (visibile soprattutto agli estremi... |
You cannot overwrite this file.
File usage on Commons
There are no pages that use this file.
File usage on other wikis
The following other wikis use this file:
- Usage on it.wikibooks.org