File:Road-way vs. railway safety.png
Jump to navigation
Jump to search

Size of this preview: 788 × 599 pixels. Other resolutions: 316 × 240 pixels | 631 × 480 pixels | 1,010 × 768 pixels | 1,280 × 974 pixels | 2,560 × 1,947 pixels | 3,337 × 2,538 pixels.
Original file (3,337 × 2,538 pixels, file size: 348 KB, MIME type: image/png)
Captions
Captions
Add a one-line explanation of what this file represents

|
This file may be updated to reflect new information. If you wish to use a specific version of the file without new updates being mirrored, please upload the required version as a separate file. |
Summary[edit]
| Description |
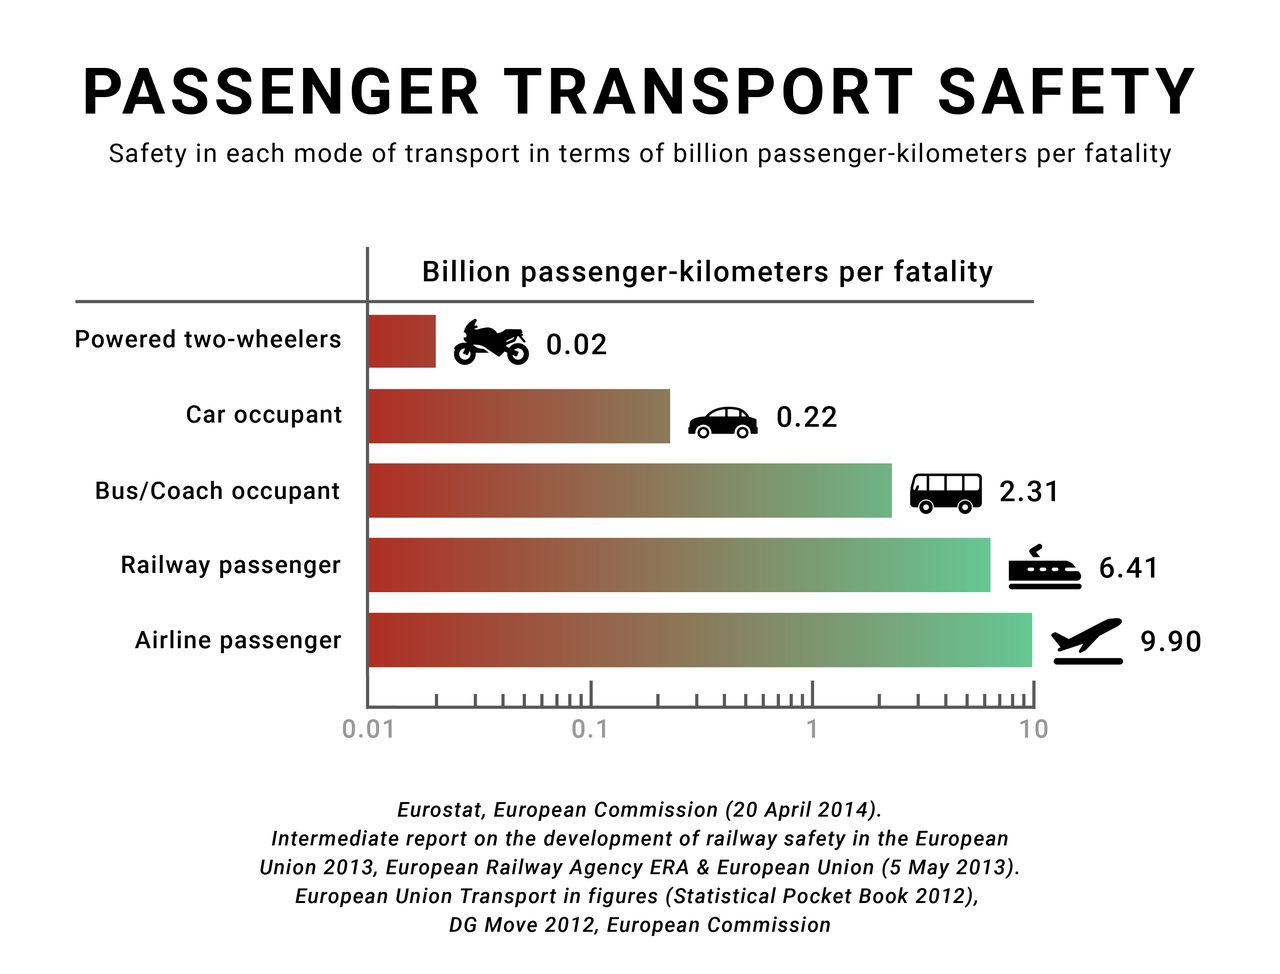
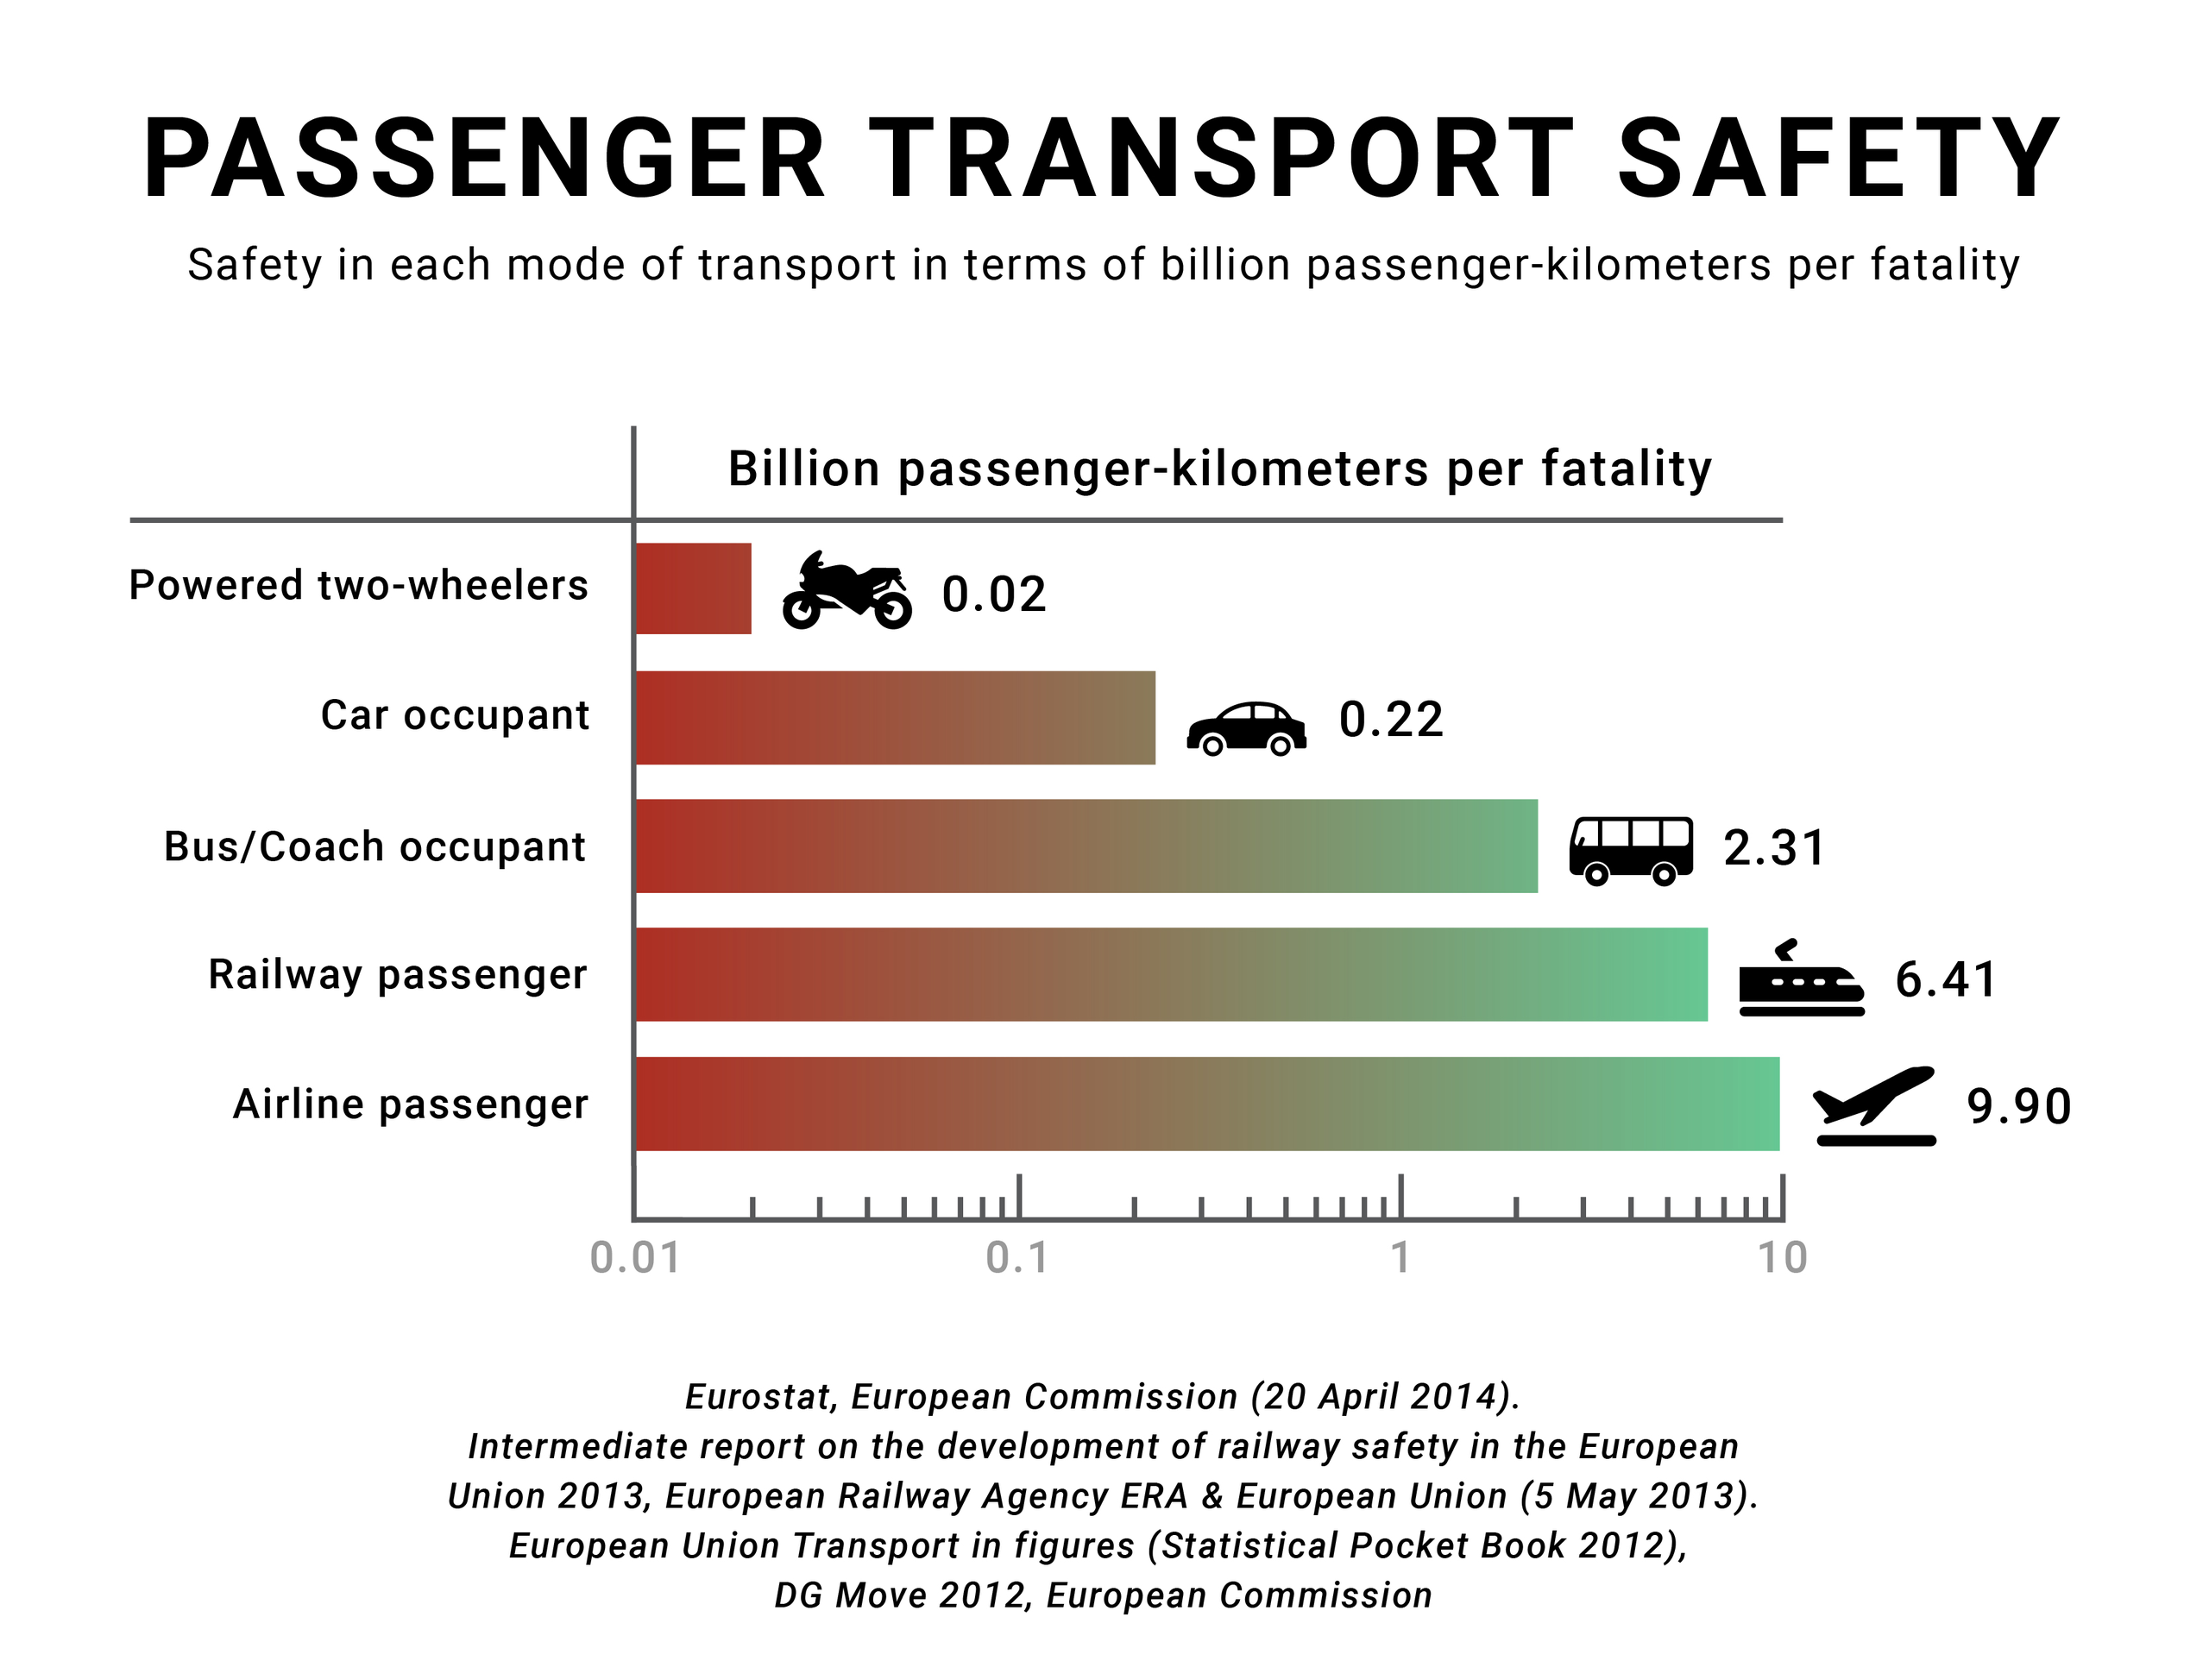
English: Fatality risk per mode of transport in European Union. Based on data by EU-27 member nations, 2008-2010. Source: Eurostat & Safety Unit, ERA Report 2013[1][2]
|
| Date | |
| Source | Intermediate report on the development of railway safety in the European Union 2013 (PDF). http://www.era.europa.eu 1. Safety Unit, European Railway Agency ERA & European Union (5 May 2013). Retrieved on 12 May 2014. |
| Author | João Pimentel Ferreira |

|
This diagram image could be re-created using vector graphics as an SVG file. This has several advantages; see Commons:Media for cleanup for more information. If an SVG form of this image is available, please upload it and afterwards replace this template with
{{vector version available|new image name}}.
It is recommended to name the SVG file “Road-way vs. railway safety.svg”—then the template Vector version available (or Vva) does not need the new image name parameter. |
Licensing[edit]
I, the copyright holder of this work, hereby publish it under the following license:
This file is licensed under the Creative Commons Attribution-Share Alike 3.0 Unported license.
- You are free:
- to share – to copy, distribute and transmit the work
- to remix – to adapt the work
- Under the following conditions:
- attribution – You must give appropriate credit, provide a link to the license, and indicate if changes were made. You may do so in any reasonable manner, but not in any way that suggests the licensor endorses you or your use.
- share alike – If you remix, transform, or build upon the material, you must distribute your contributions under the same or compatible license as the original.
File history
Click on a date/time to view the file as it appeared at that time.
| Date/Time | Thumbnail | Dimensions | User | Comment | |
|---|---|---|---|---|---|
| current | 21:54, 22 May 2019 | | 3,337 × 2,538 (348 KB) | Joao.pimentel.ferreira (talk | contribs) | invert the values considering safety insead of danger |
| 11:29, 19 May 2019 |  | 3,337 × 2,538 (341 KB) | Joao.pimentel.ferreira (talk | contribs) | The values are exactly the same, change of presentation with bar chart | |
| 21:57, 23 May 2014 |  | 1,390 × 1,510 (151 KB) | Joao.pimentel.ferreira (talk | contribs) | changed title | |
| 12:39, 11 May 2014 |  | 1,390 × 1,510 (121 KB) | Joao.pimentel.ferreira (talk | contribs) | more accurate data http://www.era.europa.eu/Document-Register/Documents/SPR%202013%20Final%20for%20web.pdf page 7 | |
| 17:45, 10 May 2014 |  | 1,543 × 977 (161 KB) | Joao.pimentel.ferreira (talk | contribs) | more accurate data | |
| 10:32, 21 April 2014 |  | 1,194 × 885 (89 KB) | Joao.pimentel.ferreira (talk | contribs) | User created page with UploadWizard |
You cannot overwrite this file.
File usage on Commons
The following page uses this file:
File usage on other wikis
The following other wikis use this file:
- Usage on ar.wikipedia.org
- Usage on en.wikipedia.org
- Usage on fa.wikipedia.org
- Usage on id.wikipedia.org
- Usage on ja.wikipedia.org
- Usage on nl.wikipedia.org