Category:Comparisons of transportation products by outcomes
Jump to navigation
Jump to search
Media in category "Comparisons of transportation products by outcomes"
The following 11 files are in this category, out of 11 total.
-
 Allocation of Space for Transport Infrastructure - Example of Berlin.png 4,267 × 4,268; 343 KB
-
 Carbon Emissions Per Passenger.png 3,718 × 4,159; 414 KB
-
 Carbon-footprint-travel-mode.png 3,400 × 2,956; 764 KB
-
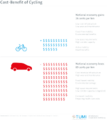 Cost-Benefit of Cycling.png 3,718 × 4,158; 290 KB
-
 Passenger Capacity of different Transport Modes.png 3,722 × 4,159; 457 KB
-
 Road Space Requirements.png 3,717 × 4,182; 308 KB
-
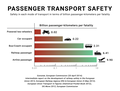 Road-way vs. railway safety.png 3,337 × 2,538; 348 KB
-
 Transport Energy Consumption in Europe.png 4,017 × 4,158; 236 KB
-
 Transport Energy Consumption.png 3,906 × 4,159; 259 KB
-
 Transports600 (English).svg 793 × 1,811; 1.07 MB
-
 Well to Wheel Efficiency.png 5,790 × 4,159; 375 KB


.svg)