File:MEW24 Accumulation 1 DE.pdf

Original file (3,475 × 2,045 pixels, file size: 15 KB, MIME type: application/pdf)
Captions
Captions
Summary[edit]
| Description |
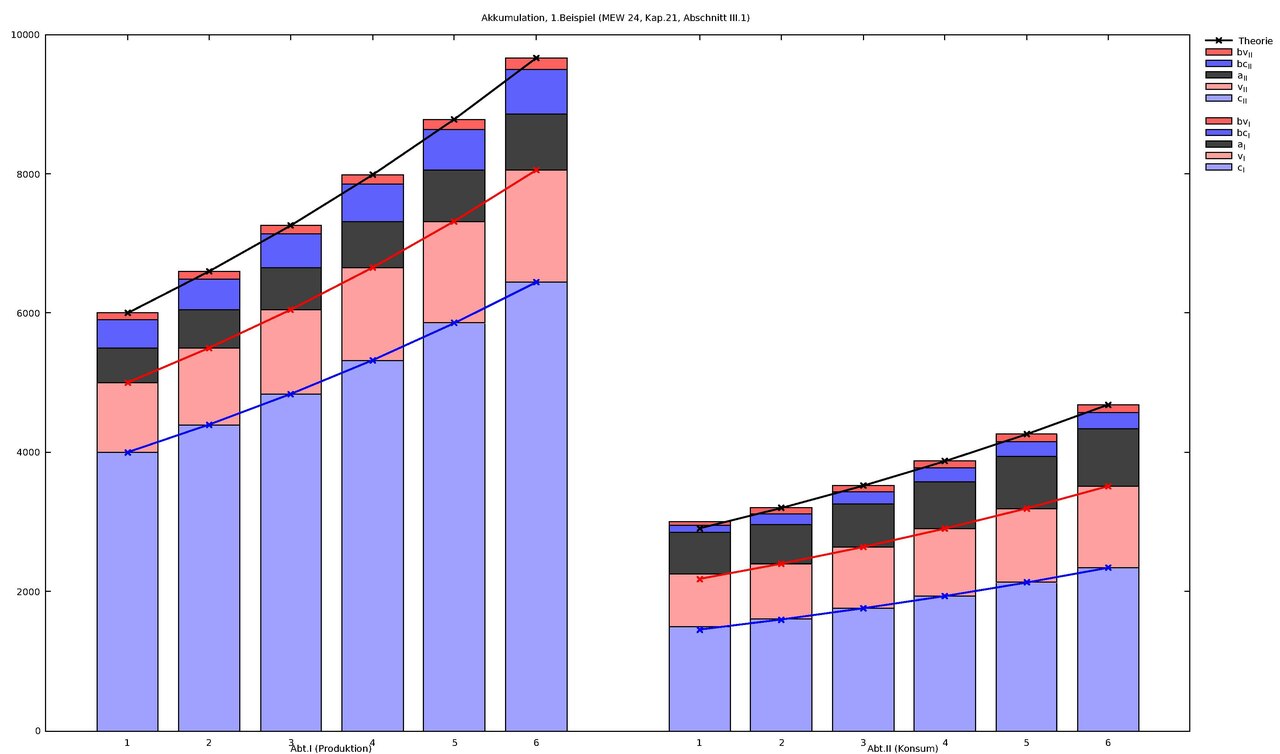
Deutsch: Akkumulation, 1.Beispiel (MEW 24, Kap.21, Abschnitt III.1.
Histogramme: Zahlen nach Marx (wiedergegeben als Tabelle in Rosdolsky.1968, S.526) —
"c": konstantes Kapital,
"v": variables Kapital,
"a": Konsum der Kapitalisten ("" bei Rosdolsky, übernommen aus Bucharin.1926),
"bc": Neuakkumulation für konstantes Kapital ("" bei Rosdolsky),
"bv": Neuakkumulation für variables Kapital ("" bei Rosdolsky).
English: Accumulation, 1st example (MEW 24, Ch.21, Sect.II.1 Histograms: Figures taken from Marx (presented as a table in Rosdolsky.1968) —
"c": constant capital,
"v": variable capital,
"a": capitalists' own consumption (called "" by Rosdolsky, taken from Bucharin.1926),
"bc": accumulation of new constant capital (called "" by Rosdolsky),
"bv": accumulation of new variable capital (called "" by Rosdolsky). |
| Date | |
| Source | Own work |
| Author | Jochen Burghardt |
| Other versions | File:MEW24 Accumulation 1 flow graph.gif (Flußgraph zu Beispiel 1) — File:MEW24 Accumulation 1 DE.pdf (Histogramm zu Beispiel 1) |


| Gnuplot source code |
|---|
set title "Akkumulation, 1.Beispiel (MEW 24, Kap.21, Abschnitt III.1)"
set key invert reverse Left outside
set key autotitle columnheader
set yrange [0:10000]
set style data histogram
set style histogram rowstacked
set style fill solid border -1
set boxwidth 0.75

plot \
    newhistogram 'Abt.I (Produktion)', \
        'MEW24 Accumulation 1.gpdat' using 2:xtic(1) lt rgb "#a0a0ff", \
        '' using  3 lt rgb "#ffa0a0", \
        '' using  4 lt rgb "#404040", \
        '' using  5 lt rgb "#6060ff", \
        '' using  6 lt rgb "#ff6060", \
    newhistogram 'Abt.II (Konsum)', \
        '' using  7:xtic(1) lt rgb "#a0a0ff", \
        '' using  8 lt rgb "#ffa0a0", \
        '' using  9 lt rgb "#404040", \
        '' using 10 lt rgb "#6060ff", \
        '' using 11 lt rgb "#ff6060"

replot '' using ($1-1):(4000*1.1**($1-1)) with linespoints lw 2 pt 2 lt rgb "#0000ff" title ""
replot '' using ($1-1):(5000*1.1**($1-1)) with linespoints lw 2 pt 2 lt rgb "#ff0000" title ""
replot '' using ($1-1):(6000*1.1**($1-1)) with linespoints lw 2 pt 2 lt rgb "#000000" title ""

replot '' using ($1+6):(1454*1.1**($1-1)) with linespoints lw 2 pt 2 lt rgb "#0000ff" title ""
replot '' using ($1+6):(2182*1.1**($1-1)) with linespoints lw 2 pt 2 lt rgb "#ff0000" title ""
replot '' using ($1+6):(2909*1.1**($1-1)) with linespoints lw 2 pt 2 lt rgb "#000000" title "Theorie"

pause -1
|
| Gnuplot data |
|---|
# Originalwerte in MEW 24, S.505-509, dort stets m = v;
# für Jahr 1-4 identisch bei Rosdolsky.1968b, S.526;
# Aufschlüsselung von Mehrwert m = a + bc + bv nur bei Rosdolsky;
#
# Abt. I in allen Jahren (eigene Extrapolation für Jahr 5-6):
#       aI   / mI  = 0.5
#       bcI  / mI  = 0.4
#       bvI  / mI  = 0.1
# Abt. II in Jahr 1:
#       aII  / mII = 0.8
#       bcII / mII = 0.1333
#       bvII / mII = 0.0666
# Abt. II in Jahr 2-6 (eigene Extrapolation für Jahr 5-6):
#       aII  / mII = 0.7
#       bcII / mII = 0.2
#       bvII / mII = 0.1
#
# c:    konstantes Kapital
# v:    variables Kapital
# a:    Konsumption der Kapitalisten ("\alpha" bei Rosdolsky, nach Bucharin)
# bc:   Neuakkumulation zum konstanten Kapital ("\beta^c")
# bv:   Neuakkumulation zum variablen Kapital ("\beta^v")
#
Jahr    c_I     v_I     a_I     bc_I    bv_I    c_{II}  v_{II}  a_{II}  bc_{II} bv_{II}
1       4000    1000    500     400     100     1500    750     600     100     50
2       4400    1100    550     440     110     1600    800     560     160     80
3       4840    1210    605     484     121     1760    880     616     176     88
4       5324    1331    666     532     133     1936    968     677     194     97
5       5856    1464    732     586     146     2129    1065    746     213     107
6 6442 1610 805 644 161 2342 1172 820 234 117 |
Licensing[edit]
- You are free:
- to share – to copy, distribute and transmit the work
- to remix – to adapt the work
- Under the following conditions:
- attribution – You must give appropriate credit, provide a link to the license, and indicate if changes were made. You may do so in any reasonable manner, but not in any way that suggests the licensor endorses you or your use.
- share alike – If you remix, transform, or build upon the material, you must distribute your contributions under the same or compatible license as the original.
File history
Click on a date/time to view the file as it appeared at that time.
| Date/Time | Thumbnail | Dimensions | User | Comment | |
|---|---|---|---|---|---|
| current | 11:18, 5 April 2019 |  | 3,475 × 2,045 (15 KB) | Jochen Burghardt (talk | contribs) | User created page with UploadWizard |
You cannot overwrite this file.
File usage on Commons
There are no pages that use this file.