File:Global temperature 1ka.png
Jump to navigation
Jump to search
Size of this preview: 800 × 475 pixels. Other resolutions: 320 × 190 pixels | 640 × 380 pixels | 1,200 × 712 pixels.
Original file (1,200 × 712 pixels, file size: 35 KB, MIME type: image/png)
Captions
Captions
Add a one-line explanation of what this file represents
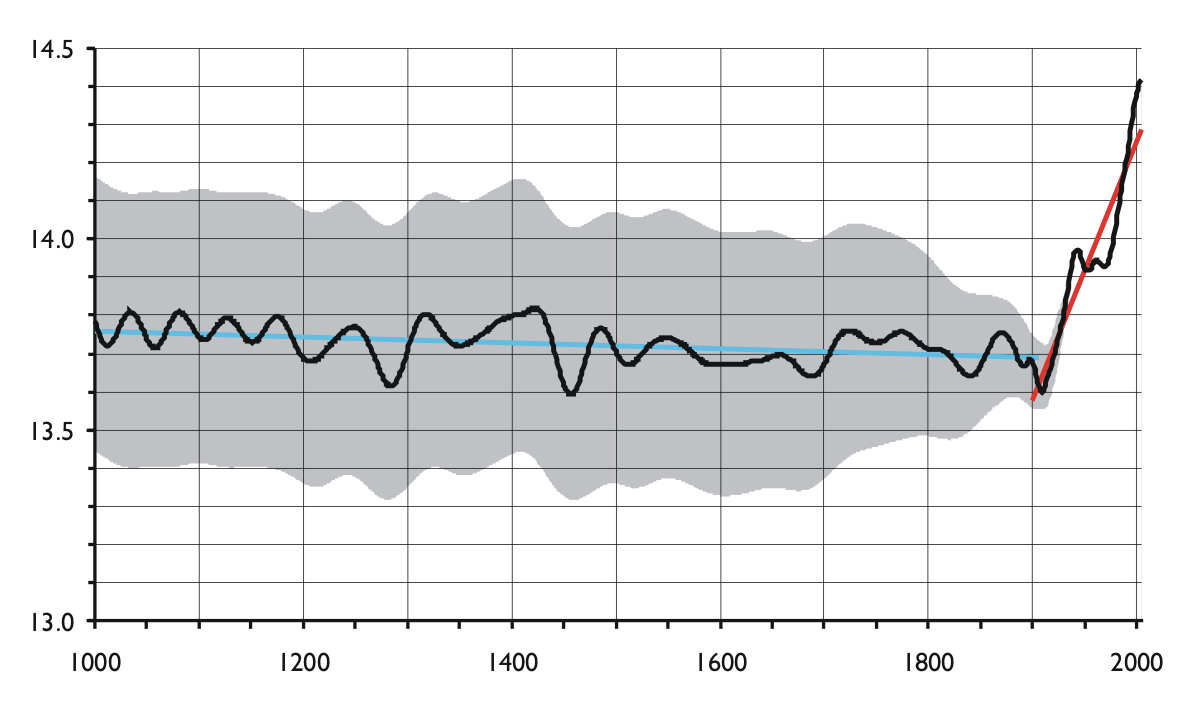
- Description: Global temperature. Axes are not labelled in order to keep the diagram language neutral; x-axis: year A.D. (1000–2004), y-axis: global temperature in °C. The black line is the smoothed global mean. The grey area is the smoothed 95% confidence interval of the estimates. The blue line is the regression line for the period 1000–1899. The red line is the regression line for the period 1900–2004.
The diagram illustrates several aspects of global warming. The rapid increase (as well as the earlier slow decrease) is statistically highly significant. One can also see that the 1990s most probably have been the last millenium's warmest decade.
Caution is required in interpretation, however, because the data prior to 1881 are estimates based on proxies (such as tree rings and ice cores). This makes both the accuracy and the temporal resolution of the estimates poorer than for the last century. Single years most certainly lay outside the confidence intervals. This does probably not affect the above conclusion about the 1990 decade, however. - Source: graph drawn by Hanno using data from two sources. For the years 1000–1880, temperature estimates were taken from P.D. Jones & M.E. Mann (2004): "Climate over past millenia". Reviews of Geophysics, 42, article number RG2002. For the remainder, temperatures are based on instrumental records published on the web by P.D. Jones, D.E. Parker, T.J. Osborn & K.R. Briffa (2005) as "Global and hemispheric temperature anomalies – land and marine instrumental records". In Trends: A Compendium of Data on Global Change. Carbon Dioxide Information Analysis Center, Oak Ridge National Laboratory, U.S. Department of Energy, Oak Ridge, Tenn., U.S.A. [http://cdiac.esd.ornl.gov/trends/temp/jonescru/jones.html]
- Licence: released into the public domain by the originator
| I, the copyright holder of this work, release this work into the public domain. This applies worldwide. In some countries this may not be legally possible; if so: I grant anyone the right to use this work for any purpose, without any conditions, unless such conditions are required by law. |

|
This graph image could be re-created using vector graphics as an SVG file. This has several advantages; see Commons:Media for cleanup for more information. If an SVG form of this image is available, please upload it and afterwards replace this template with
{{vector version available|new image name}}.
It is recommended to name the SVG file “Global temperature 1ka.svg”—then the template Vector version available (or Vva) does not need the new image name parameter. |
File history
Click on a date/time to view the file as it appeared at that time.
| Date/Time | Thumbnail | Dimensions | User | Comment | |
|---|---|---|---|---|---|
| current | 15:49, 9 November 2005 | | 1,200 × 712 (35 KB) | Hanno (talk | contribs) |
You cannot overwrite this file.
File usage on Commons
The following page uses this file:
File usage on other wikis
The following other wikis use this file:
- Usage on fr.wikipedia.org
- Usage on ja.wikipedia.org