File:Changes in HDI values from 2018 to 2019 report.png
Jump to navigation
Jump to search

Size of this preview: 800 × 355 pixels. Other resolutions: 320 × 142 pixels | 640 × 284 pixels | 1,024 × 455 pixels | 1,280 × 569 pixels | 2,560 × 1,137 pixels | 6,101 × 2,710 pixels.
Original file (6,101 × 2,710 pixels, file size: 1.87 MB, MIME type: image/png)
Captions
Captions
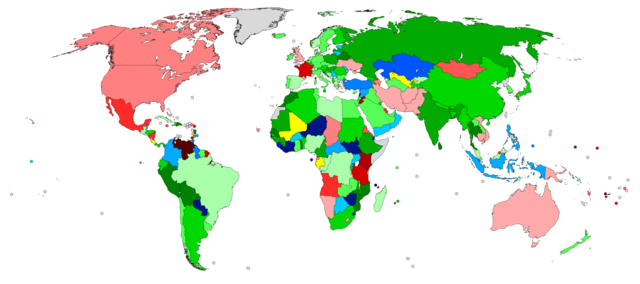
Choropleth map showing changes in HDI values, from the 2018 report to the 2019 report.
Summary
[edit]
| Description |
English: A choropleth map showing the changes of points on the Human Development Index, from the 2018 report to the 2019 report.
+over 0.020
+0.019–0.020
+0.017–0.018
+0.015–0.016
+0.013–0.014
+0.011–0.012
+0.009–0.010
+0.007–0.008
+0.005–0.006
+0.003–0.004
+0.001–0.002
No increase/decrease
−0.001–0.002
−0.003–0.004
−0.005–0.006
−0.007–0.008
−0.009–0.010
−0.010–0.015
−0.015–0.020
−over 0.020 |
| Date | |
| Source | Own work |
| Author | JackintheBox |
Licensing
[edit]
I, the copyright holder of this work, hereby publish it under the following license:
This file is licensed under the Creative Commons Attribution-Share Alike 4.0 International license.
- You are free:
- to share – to copy, distribute and transmit the work
- to remix – to adapt the work
- Under the following conditions:
- attribution – You must give appropriate credit, provide a link to the license, and indicate if changes were made. You may do so in any reasonable manner, but not in any way that suggests the licensor endorses you or your use.
- share alike – If you remix, transform, or build upon the material, you must distribute your contributions under the same or compatible license as the original.
File history
Click on a date/time to view the file as it appeared at that time.
| Date/Time | Thumbnail | Dimensions | User | Comment | |
|---|---|---|---|---|---|
| current | 14:29, 10 December 2019 | | 6,101 × 2,710 (1.87 MB) | JackintheBox (talk | contribs) | User created page with UploadWizard |
You cannot overwrite this file.
File usage on Commons
There are no pages that use this file.