Data flow diagram
Jump to navigation
Jump to search
English: A data flow diagram (DFD) is a graphical representation of the flow of data through an information system. A DFD shows the flow of data from data sources and data stores to processes, and from processes to data stores and data sinks. DFDs are used for modelling and analyzing the flow of data in data processing systems, and are usually accompanied by a data dictionary, an entity-relationship model, and a number of process descriptions.
Types of structure[edit]
-
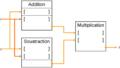 Simple structure
 -
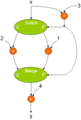
 Iteration
 -
 Manchester architecture


Types of flow[edit]
-
 Condition type graph
 -
 if condition
 -
 while loop
 -
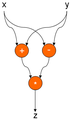 Computation involving several nodes


Building blocks[edit]
-
 Switch type node
 -
 Merge type node
 -
 Computational node
 -
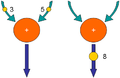 Firing node
 -
 Data flow note
 -
 Notation


Data flow diagram levels[edit]
-
 Context level
 -
 Level 0 Data flow diagram for the same system.
 -
 Level 1 Data flow diagram showing the "Process Enquiry" process for the same system.
