Commons talk:IUCN Red List
OTRS permission[edit]
Has the process been started to get the OTRS ticket number and all that rolling? — raeky (talk | edits) 18:14, 17 June 2010 (UTC)
- No, how does that work? Should I send the email correspondence to OTRS? GoEThe (talk) 18:15, 17 June 2010 (UTC)
- If in the e-mail conversation you had with them they explicitly (a) confirmed they own the copyright of the data and (b) gave explicit permission to use the data under a compatible license then you can forward that e-mail conversation (all the relevant e-mails with FULL headers) to the OTRS e-mail, otherwise you'll need to get them to e-mail the OTRS e-mail, theres an example e-mail they can use that's just fill in the blanks if you want on Commons:OTRS. You'll also need to e-mail the OTRS e-mail and point them to the license template, and other relevant pages on here so they know where to edit. — raeky (talk | edits) 11:21, 18 June 2010 (UTC)
- I have asked them to send an email, but I don't know if they already sent it or not. GoEThe (talk) 11:33, 23 June 2010 (UTC)
- They just told me they will send the permission today. GoEThe (talk) 11:10, 1 July 2010 (UTC)
- I have asked on Commons:OTRS/Noticeboard to advise on the procedure (And i hope it will speed up the process :-) ). I will prepare some more samples now... Uwe Dedering (talk) 09:18, 2 July 2010 (UTC)
- I just received a confirmation that the email was sent TODAY. Let's just wait to see if all is correct. GoEThe (talk) 12:58, 5 July 2010 (UTC)
- I have asked on Commons:OTRS/Noticeboard to advise on the procedure (And i hope it will speed up the process :-) ). I will prepare some more samples now... Uwe Dedering (talk) 09:18, 2 July 2010 (UTC)
- They just told me they will send the permission today. GoEThe (talk) 11:10, 1 July 2010 (UTC)
- I have asked them to send an email, but I don't know if they already sent it or not. GoEThe (talk) 11:33, 23 June 2010 (UTC)
- If in the e-mail conversation you had with them they explicitly (a) confirmed they own the copyright of the data and (b) gave explicit permission to use the data under a compatible license then you can forward that e-mail conversation (all the relevant e-mails with FULL headers) to the OTRS e-mail, otherwise you'll need to get them to e-mail the OTRS e-mail, theres an example e-mail they can use that's just fill in the blanks if you want on Commons:OTRS. You'll also need to e-mail the OTRS e-mail and point them to the license template, and other relevant pages on here so they know where to edit. — raeky (talk | edits) 11:21, 18 June 2010 (UTC)
Templates[edit]
We need to create a template for source/attribution and a license template that has the OTRS tag. — raeky (talk | edits) 18:15, 17 June 2010 (UTC)
- I created {{IUCN map permission}} based on {{AntWeb permission}}. I am not sure how to do the other one. Can you show me an example? GoEThe (talk) 09:44, 18 June 2010 (UTC)
- That will work for the permission template, these are the source templates: Category:Source_templates but one of these may not be necessary. — raeky (talk | edits) 11:17, 18 June 2010 (UTC)
List of species[edit]
I have made a list with all the species of mammals, reptiles and amphibians, IUCN has spatial data on. I am trying to download the Coral species now, and the Bird species are not available on the website. I'll have to ask if they will be included in the partnership. The list is located here User:GoEThe/IUCN. GoEThe (talk) 14:18, 18 June 2010 (UTC)
- I copied it to en.wikipedia so we can see how many species there have pages... seems like A LOT of them: en:User:Raeky/IUCN — raeky (talk | edits) 14:44, 18 June 2010 (UTC)
- A lot of species pages were created by bot (en:User:Polbot/older tasks), based on the IUCN red list. GoEThe (talk) 14:56, 18 June 2010 (UTC)
- Now to get a bot to generate the maps. :D — raeky (talk | edits) 15:07, 18 June 2010 (UTC)
- I'm not a bot, but have started modifying my software I used for some location maps (File:Russia_edcp_relief_location_map.jpg or File:India_location_map.svg) and i will try to make some examples. Uwe Dedering (talk) 21:52, 21 June 2010 (UTC)
- Wow, those look great. Looking forward to see some examples. GoEThe (talk) 08:45, 22 June 2010 (UTC)
- I have uploaded a sample here: de:File:Lynx lynx distribution map.svg. Lot's of work to do... Uwe Dedering (talk) 14:36, 25 June 2010 (UTC)
- That looks good though, many will need cropped though, but it's a start! — raeky (talk | edits) 18:04, 25 June 2010 (UTC)
- That looks very nice, indeed. There is a function in ArcGIS to zoom to selected feature. Is it possible to do like that in your software, Uwe Dedering? GoEThe (talk) 11:09, 1 July 2010 (UTC)
- It is possible to choose a different clipping, but this makes no sense for the en:Winkel tripel projection map, which is for the world. Uwe Dedering (talk) 09:23, 2 July 2010 (UTC)
- The only problem is that some species will have a very limited distribution, not visible on the world scale. Will it be possible to distinguish species with limited distributions from species with wide distributions? We could then get an idea of the extent of the issue. GoEThe (talk) 13:00, 2 July 2010 (UTC)
- It is possible to choose a different clipping, but this makes no sense for the en:Winkel tripel projection map, which is for the world. Uwe Dedering (talk) 09:23, 2 July 2010 (UTC)
- That looks very nice, indeed. There is a function in ArcGIS to zoom to selected feature. Is it possible to do like that in your software, Uwe Dedering? GoEThe (talk) 11:09, 1 July 2010 (UTC)
- That looks good though, many will need cropped though, but it's a start! — raeky (talk | edits) 18:04, 25 June 2010 (UTC)
- I have uploaded a sample here: de:File:Lynx lynx distribution map.svg. Lot's of work to do... Uwe Dedering (talk) 14:36, 25 June 2010 (UTC)
- Wow, those look great. Looking forward to see some examples. GoEThe (talk) 08:45, 22 June 2010 (UTC)
- I'm not a bot, but have started modifying my software I used for some location maps (File:Russia_edcp_relief_location_map.jpg or File:India_location_map.svg) and i will try to make some examples. Uwe Dedering (talk) 21:52, 21 June 2010 (UTC)
- Now to get a bot to generate the maps. :D — raeky (talk | edits) 15:07, 18 June 2010 (UTC)
- A lot of species pages were created by bot (en:User:Polbot/older tasks), based on the IUCN red list. GoEThe (talk) 14:56, 18 June 2010 (UTC)
Spatial data update[edit]
The IUCN people informed me that there will be an update of the data scheduled for September 2nd. The data for Reptiles and Corals will not be updated this time around, so I suggest that we start with those. Also, the bird data is not at the IUCN web site, but it is kept by Birdlife international. I guess we can try to contact them as well, but I think we have enough work on our hands at the moment. GoEThe (talk) 14:54, 1 July 2010 (UTC)
- I wish someone who was great with en:GRASS GIS would post the procedures on how to make a map with this data with that program. I can't figure it out, it's WAAAY over my head. — raeky (talk | edits) 15:33, 1 July 2010 (UTC)
- I never used that software, but if you are willing to try en:ILWIS, I have some experience with it a couple of years ago, so maybe I can figure out how to do in that one more easily and provide a tutorial. GoEThe (talk) 14:36, 2 July 2010 (UTC)
- That'll work, it's free software too. — raeky (talk | edits) 16:32, 2 July 2010 (UTC)
- OK, another go. I am trying now en:Quantum GIS, free, and open-source, and integrates well with Grass GIS, apparently. It also appears to have a nice GUI and easy to use functions. Want to give it a go? GoEThe (talk) 13:25, 15 July 2010 (UTC)
- If you can post directions on how to make maps with it, sure. ;-) — raeky (talk | edits) 17:46, 15 July 2010 (UTC)
- It's pretty easy (I hope). Just open the program, then in the layer menu, click add vector layer (for shapefiles) or add raster layer (for geoTIFF or other types). The layers will appear in the left sidebar. You can drag and drop to change the order, and right click to change properties (you will want to change the colour probably). In the species layer, go to the properties menu, and click simbology, change "legend type" to "unique value", "classification field" to "BINOMIAL", and then click "Classify". This will make one colour for each species. You can then choose the species you are interested in and delete all the others or click add class and double click the 0 in the side bar to change it to the name of the species you are interested in, and then change the colour of the outline and the fill, as you wish. You can then save it as.png or try to export it to .svg. To export to .svg you have to the "print composer" (Ctrl+P), and click on the map icon, then click drag on the blank page. Then the second button to the left is export to svg. I am not sure if the quality of the svg will be good, but you can also print to pdf and then import it to inkscape, to save as svg. GoEThe (talk) 09:23, 16 July 2010 (UTC)
- If you can post directions on how to make maps with it, sure. ;-) — raeky (talk | edits) 17:46, 15 July 2010 (UTC)
- OK, another go. I am trying now en:Quantum GIS, free, and open-source, and integrates well with Grass GIS, apparently. It also appears to have a nice GUI and easy to use functions. Want to give it a go? GoEThe (talk) 13:25, 15 July 2010 (UTC)
- That'll work, it's free software too. — raeky (talk | edits) 16:32, 2 July 2010 (UTC)
- I never used that software, but if you are willing to try en:ILWIS, I have some experience with it a couple of years ago, so maybe I can figure out how to do in that one more easily and provide a tutorial. GoEThe (talk) 14:36, 2 July 2010 (UTC)
I created two versions from the above directions. File:Qgis test 1.svg and File:Qgis test 2.png, the svg I outputted via the "print composer" but it was fairly bugged, it created a pretty massive file that included lots more then it should, I cropped the art board in illustrator to where it should be though. The .png I made by saving out a .tif and converting that to .png. Theres some issues, like meaningful scales, and other crap to know where in this world this is (this is Tanzania btw). Suggestions? — raeky (talk | edits) 13:29, 17 July 2010 (UTC)
I got the same problem with svg using Qgis (see File:Ablepharus bivittatus range map.svg. Couldn't you save directly to .png in the save as image menu? GoEThe (talk) 16:38, 19 July 2010 (UTC)
- Suggestions on how to make them nice? :P — raeky (talk | edits) 18:49, 19 July 2010 (UTC)
I noticed loading up the land mammals data set lags the program on my computer so bad that it's not usable... Unless we can break up those datasets, I don't think this program will work very well... (and my computer isn't exactly super slow (Intel Core2 Duo E8500 (3.16ghz) and 8gb ram, vista 64bit.). — raeky (talk | edits) 22:43, 19 July 2010 (UTC)
- There is a script for ArcGIS [1] that can do that, I am sure it is possible to do it in other programs, but that is a bit over my head. GIS programs are always memory intensive. Maybe there is a simpler program just for mapping that doesn't use so much memory, I don't know. As for making it nicer, you can overlay another map on the print composer, and set it to whatever scale you want, and you can add a scale bar, by using one of the buttons on the menu bar. GoEThe (talk) 09:35, 20 July 2010 (UTC)
- I tried another program called Open JUMP [2], and it creates nice looking svg files. Check out [3] and compare it with the older version. It wasn't able to include the nice relief background (memory issues, I think), but at least the svg conversion looks good. GoEThe (talk) 14:07, 22 July 2010 (UTC)
Draft tutorial for Ilwis[edit]
This is still a bit incomplete, but should help you get started with ILWIS:
- Open Ilwis
- On the main window, there should be a tab called "operation tree" on the left bar.
- Click "Import/Export".
- "Import map".
- Select the type of file you want to import (usually "Arc/View .SHP shape file)
- Choose output name.
- Right click on the map icon on the main window.
- Choose properties.
- Define "Coordinate system" (Usually LatLongWGS84)
- Double clik map icon.
- Choose "display options" (have to figure out how to represent just one feature at a time)
- Usually you will want to check "Attribute" and choose the appropriate field in the dropdown menu.
- If you want to represent attributes by a gradient of color pick "Representation" instead of "Single Color".
Comments[edit]
I got it to where I could do the conversion, which is basicly all of the above instructions, but it blends all the paths for all the species into one big conglomerate and I can't figure out how to do just 1 species, then combine that with a world map under it so that I can get it all to look nice. ;-) — raeky (talk | edits) 15:08, 5 July 2010 (UTC)
- I haven't figured out the part about the coloring only one species. To add another layer to the map, you have to open one map and in the new window on the layer menu, click add layer. You have to make sure that the layers have the correct georreferencing. I know it is somewhat of a pain to get this right in ILWIS, and I don't remember how to do it exactly. It will take some more fiddling around. GoEThe (talk) 15:18, 5 July 2010 (UTC)
- Well, know I remember why I stopped using ILWIS. I couldn't find a way to only colour one species. Frustrating! GoEThe (talk) 16:06, 6 July 2010 (UTC)
Examples[edit]
I have made 3 Examples with different styles. See here : German Map Lab. Uwe Dedering (talk) 11:59, 8 July 2010 (UTC)
- I really love the map with the relief. I continue to have problems with the svg export, and I might have to change software to be able to get svg files. GoEThe (talk) 15:05, 12 July 2010 (UTC)
I have now uploaded a few maps. See below:
-
 Podarcis hispanicus
 -
 Ablepharus kitaibelii
 -
 Ablepharus chernovi
 -
 Ablepharus budaki
 -
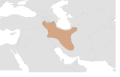 Ablepharus bivittatus


I used Open JUMP as mentioned above. The image looks a bit compressed on the sides. I don't know how to fix that. Any comments? GoEThe (talk) 14:53, 28 July 2010 (UTC)
- Its compressed everywhere... What projection did you use? And you can not take sections of the bigger map, you have to make new ones, sometimes with another projection... Uwe Dedering (talk) 16:22, 28 July 2010 (UTC)
- I just used the default projection (not sure which one it is). OpenJUMP does not support re-projection on the fly, but there is a plugin [4] that can do that. I will try to work that out and see if it solves the problem. GoEThe (talk) 09:59, 30 July 2010 (UTC)
- It looks like the en:Equirectangular projection, but I could be wrong. GoEThe (talk) 11:56, 30 July 2010 (UTC)
Clearer instructions please[edit]
Now that this is linked from the main page, I would appreciate if someone could write step-by-step instructions for how to make an awesome species map using free software. I might be willing to help on this project if the instructions were simple enough, but as it is, it looks like I would need to invest too much time just to learn how to do it. I haven't read this page in detail, but my first impression is that there are also a few things lacking.
- The recommendation is to load maps from third party sites. Why don't we have a viable map on Commons?
- The grey in the examples on this talk page seems too light.
- Instructions should definitely favour production of an svg map. If anyone wants a png too, go for it, but please also make an svg.
--99of9 (talk) 00:58, 28 August 2010 (UTC)
- The maps used for GIS software are usually in .shp format, which is not supported in Commons, as far as I know. SVG export in ArcGIS for example is completely rubbish, that is why I think it is important to consider other formats. GoEThe (talk) 13:25, 6 September 2010 (UTC)
Standardize this[edit]
The instructions say "check for newer data", which worries me. It's nice to shoot for an up-to-date resource, but it's also nice to have a single reliable snapshot made from the dataset given to us. And in this case, "updating" the files means having just a few with a different date than all the rest. Bear in mind that eventually, we'll have the option to create video files where people can watch the range of each species steadily shrink and disappear over time.
I think that every file made by this process should contain "2009", and should stick to the 2009 data. If 2010, etc. data becomes available then the number should change and a new file should be created. I would further suggest that people should come up with one single standard file name that is appropriate to make from each IUCN entry. For example, should "IUCN" be part of the file name, should the species naming authority be mentioned, should the country/region name be omitted, should common name be mentioned (I'd say YNNN, I think...) - if you can come up with a single predictable name, it means that automated software can extract and display the file for every species on Wikispecies and [from a species taxobox with the scientific name] Wikipedia Wnt (talk) 16:36, 7 September 2010 (UTC)
- IUCN was doing updates two times a year, up to now. Currently they just released the 3rd version for 2010, and they just informed me that they will do another one by the end of October this year. I think that keeping track of how the distribution changes through the versions will be great. From what they told me, there are a bit more than 100 maps of amphibians, for example, were changed in this last update. Also, they are going to provide me the script they use to generate the maps, so I will be able to generate all of them very quickly. Probably within 3-4 weeks I should get the script running. I think that scientific names should be preferred, since this is a multilingual project, so I would suggest naming all of them "Genus species range map IUCN 2010.3" with 2010.3 referring to the red list version. Although not having the IUCN... part would make the file name easier to find. GoEThe (talk) 18:24, 7 September 2010 (UTC)
New developments[edit]
Hi, I've been talking again with the IUCN people and they are actually interested in producing all the maps themselves to give it a consistent look. I've uploaded a few of the samples they provided me before they produce the whole batch. I would appreciate your comments on the maps, if anything should be changed regarding colours or anything else. These are gifs, but I think they will be able to produce png's just as easily. I am not sure about svg's though. The files I uploaded are:


![[3]](https://upload.wikimedia.org/wikipedia/commons/c/cb/Ablepharus_bivittatus_range_map.svg)
GoEThe (talk) 19:07, 28 September 2010 (UTC)
- These maps look terrible... Uwe Dedering (talk) 10:55, 29 September 2010 (UTC)
- Definition can be improved, these are just tests. But is there anything else that needs improving? GoEThe (talk) 13:58, 29 September 2010 (UTC)
- These maps do look terrible. They convey very little information. But I understand if IUCN wants a consistent look and feel. What confuses me is that they seem to be saying that they no longer want our help, which leads me to wonder why this page is still up. I'll finish uploading the maps I've made; perhaps someone can use them, but beyond that, I'm abandoning this project until I gain a clear understanding of what IUCN expects from us, if anything. Rhalden (talk) 19:34, 2 October 2010 (UTC)
- Hi, Rhalden. Just to give you a perspective of how this project came about. So, I contacted IUCN to see if they would like to help us to complement our articles on species with the distribution maps. They have maps on their website in png format [5], so they don't really need our help to produce these. It was discussed in the beginning if we could use their original maps, but we discarded that idea as those maps have a lot of information we usually keep for the legends and the preferred format here is svg, not png. At the time, I thought it would be better (and easier) to produce customized maps, as we could choose the format, and choose a consistent look comparable to maps we already were using. As work was going slowly, and we haven't really decided on a common process, layout and so on to produce these, they offered to adapt the script they used for their website to produce the maps massively and consistently. They chose a layout that looked similar to maps we already have, but the script can be adapted to have more detail in the maps. I would just need your feedback on what should be in the maps. Other than that, a lot of work is still needed: categorization, placing them in the articles, etc. I am sorry if this seems a step back. GoEThe (talk) 09:31, 4 October 2010 (UTC)
- These maps do look terrible. They convey very little information. But I understand if IUCN wants a consistent look and feel. What confuses me is that they seem to be saying that they no longer want our help, which leads me to wonder why this page is still up. I'll finish uploading the maps I've made; perhaps someone can use them, but beyond that, I'm abandoning this project until I gain a clear understanding of what IUCN expects from us, if anything. Rhalden (talk) 19:34, 2 October 2010 (UTC)
- Definition can be improved, these are just tests. But is there anything else that needs improving? GoEThe (talk) 13:58, 29 September 2010 (UTC)
"These look terrible" is not really very useful, is it? What do you think is wrong with them? Apart from the red being rather garish, I disagree... I think they're fine, and more to the point: Useful. And I think that having the creation of the images done by IUCN makes sense foe all sorts of reasons. Could use help with other parts of getting the results "out there", though? Tkbwikmed (talk) 08:21, 27 October 2010 (UTC)
- Indeed, we do! I am currently waiting for some feedback on Commons:Batch uploading/IUCN red list to upload a few thousand maps. When someone uploads them, there is a lot of work to be done in including them in the projects. Even write new articles on Wikipedia for some of the species. GoEThe (talk) 08:48, 27 October 2010 (UTC)
- Will it be possible to get them as svg's instead of raster? Considering that their original data is a vector format it's probably as easy/hard for them to generate as raster images anyway. As for looks, a softer red and a lighter grey would be good. Great initiative though =) /Lokal_Profil 11:48, 29 November 2010 (UTC)
What's wrong with the maps is that they convey very little information. That makes them hard to read. You need labels, administrative boundaries, hollow/transparent polygons, a legend... I mean, what does the IUCN really want? I've looked at their own maps and they are decent, but these are too simple. This is coming from someone who makes maps and is involved in GIS every day, so I'm not pulling it out of you-know-where. Once I read this page, though, I lost all excitement for the project. And I won't even get into how painful it is to navigate/upload things on this website! Ugh! Good luck to you. Shadow67 (talk) 17:07, 7 December 2010 (UTC)
A tutorial for Perl and Inkscape[edit]
Mysid is doing some nice maps using Inkscape and Perl. Here he explained how he is doing it: [6]. GoEThe (talk) 13:31, 17 November 2010 (UTC)
posted to osm list[edit]
I have posted this to the openstreetmap list, surely people would be interested mapy to add this infomation to OSM and to help make maps here. mike Mdupont (talk) 20:58, 8 December 2010 (UTC)
Help still needed?[edit]
Any comment here about whether a blurb about this still needs to be on the frontpage would be appreciated. Thank you.--Chaser (talk) 05:15, 24 December 2010 (UTC)