Category:Violin plots
Jump to navigation
Jump to search
method of plotting numeric data  | |||||
| Upload media | |||||
| Instance of | |||||
|---|---|---|---|---|---|
| Subclass of | |||||
| |||||
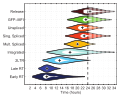
Violin plots are a method of plotting numeric data. A violin plot is a combination of a box plot and a kernel density plot. Specifically, it starts with a box plot. It then adds a rotated kernel density plot to each side of the box plot.
Media in category "Violin plots"
The following 6 files are in this category, out of 6 total.
-
 DuBois et al., 2021 Poster Violin Plot.png 993 × 835; 351 KB
-
 Ggplot2 Violin Plot.png 512 × 512; 40 KB
-
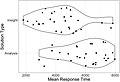 Insight, response time and problem solving.jpg 1,713 × 1,172; 116 KB
-
 Violin plot.gif 792 × 612; 22 KB
-
 Violinplot-hiv-paper-plot-pathogens.png 968 × 822; 76 KB
-
 Violinplot-hiv-paper-plot-pathogens.svg 282 × 225; 340 KB


