Category:Production maps of the world
Jump to navigation
Jump to search
Media in category "Production maps of the world"
The following 97 files are in this category, out of 97 total.
-
 2005crustacean.PNG 1,425 × 625; 58 KB
-
 2005dattes.png 1,425 × 625; 59 KB
-
 2005plywood.PNG 1,425 × 625; 58 KB
-
 2007niobium (mined).PNG 1,425 × 625; 60 KB
-
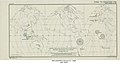
 An atlas of commercial geography (1913) (14594763908).jpg 1,676 × 2,904; 1.25 MB
-
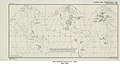
 An atlas of commercial geography (1913) (14758386396).jpg 2,384 × 2,974; 1.64 MB
-
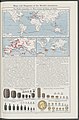
 An atlas of commercial geography (1913) (14801250363).jpg 1,626 × 1,898; 793 KB
-
 Bean production, world map, OWID.svg 850 × 600; 154 KB
-
 Cotton textile industry in world.jpg 640 × 417; 66 KB
-
 Countries by agricultural output.PNG 1,541 × 631; 51 KB
-
 Countries by services output.PNG 1,572 × 637; 40 KB
-
 Das Kürschner-Handwerk, 3. Teil, S. 34, Herkommen der Fehfelle.jpg 2,303 × 1,949; 531 KB
-
 Diamond output2.png 800 × 351; 87 KB
-
 Diamond production, OWID.svg 850 × 600; 139 KB
-
 Domestic-material-consumption-per-capita,2017.png 3,400 × 2,400; 730 KB
-
 Fish-seafood-production (OWID 0432).png 850 × 600; 100 KB
-
 Global livestock densities map by Agtelier.jpg 2,000 × 1,333; 407 KB
-
 Gold (mined)2.png 1,425 × 625; 62 KB
-
 Habasit Worldmap.jpg 800 × 466; 45 KB
-
 Hydropower generation, OWID.svg 850 × 600; 141 KB
-
 Industrial production growth rate (%) in 2017.png 6,300 × 3,520; 2.12 MB
-
 KarteSteinkohleproduktion.png 1,357 × 628; 25 KB
-
 Location of coal miners globally.png 1,920 × 1,080; 497 KB
-
 Main manufacturer of the air transports of the heads of the state and the government.png 6,460 × 3,642; 2.01 MB
-
 Meat production, OWID.svg 850 × 600; 142 KB
-
 Meat-production-tonnes (OWID 0662).png 850 × 600; 110 KB
-
 Milchproduktion.png 1,357 × 628; 25 KB
-
 Motor vehicles produced by country 2013.png 1,568 × 757; 372 KB
-
 Motor vehicles produced by country evolution.gif 1,697 × 848; 669 KB
-
 Natural gas production (in million cubic metres) 2006.png 1,743 × 794; 125 KB
-
 Oil producing countries map-it.svg 790 × 387; 1.52 MB
-
 Oil producing countries map.PNG 1,427 × 628; 45 KB
-
 Oil producing countries map.png 1,427 × 628; 60 KB
-
 Oil producing countries.2010.png 1,427 × 628; 60 KB
-
 Oil producing USA-states-Canada-provinces map.svg 1,730 × 1,730; 218 KB
-
 Olive oil production, world map, OWID.svg 850 × 600; 156 KB
-
 OMV Upstream Jahresproduktion pro Land 2019.jpg 796 × 661; 64 KB
-
 OMVupstreamportfolio2019.png 775 × 646; 106 KB
-
 Pea-production (OWID 0674).png 850 × 600; 93 KB
-
 Pigmeat production, OWID.svg 850 × 600; 141 KB
-
 Pigmeat-production-tonnes (OWID 0845).png 850 × 600; 107 KB
-
 Pigmeat-production-tonnes.png 3,400 × 2,400; 782 KB
-
 Poultry production, OWID.svg 850 × 600; 141 KB
-
 Poultry-production-tonnes (OWID 0812).png 850 × 600; 104 KB
-
 Rye-production (OWID 0961).png 850 × 600; 92 KB
-
 Saffron crocus sativus modern world production.png 1,357 × 628; 29 KB
-
 Saffron crocus sativus production.svg 863 × 436; 1.12 MB
-
 Sesame-seed-production (OWID 0951).png 850 × 600; 90 KB
-
 Share-electricity-hydro.svg 850 × 600; 163 KB
-
 Share-electricity-solar.svg 850 × 600; 163 KB
-
 Soybean-production (OWID 1078).png 850 × 600; 96 KB
-
 Stahlproduzenten Weltkarte.png 554 × 254; 38 KB
-
 Sugar-cane-production.png 3,400 × 2,400; 705 KB
-
 Sunflower-seed-production (OWID 1067).png 850 × 600; 93 KB
-
 Sweet-potato-production (OWID 1058).png 850 × 600; 92 KB
-
 Tomato-production (OWID 1042).png 850 × 600; 96 KB
-
 Uranium production world-ar.png 4,948 × 2,170; 911 KB
-
 Uranium production world.PNG 1,425 × 625; 59 KB
-
 World Arsenic Production 2006.svg 940 × 415; 1.45 MB
-
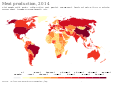
 World Lead Production 2014.svg 940 × 415; 1.45 MB
-
 World Manganese Production 2006.svg 940 × 415; 1.45 MB
-
 World map of motor vehicle production, 2000.svg 940 × 415; 1.47 MB
-
 World map of motor vehicle production, 2005.svg 940 × 415; 1.45 MB
-
 World map of motor vehicle production, 2007.svg 940 × 415; 1.45 MB
-
 World map of motor vehicle production, 2009.svg 512 × 226; 880 KB
-
 World Niobium Production 2006.svg 940 × 415; 1.45 MB
-
 World Strontium Production 2014.svg 940 × 415; 1.45 MB
-
 World Tantalum Production 2006.svg 940 × 415; 1.45 MB
-
 World Tantalum Production 2015.svg 940 × 415; 1.45 MB
-
 World- Aluminum Ore Production, 1946 - DPLA - c667460ff48f78e1c3f7f6ea88ca6f7a.jpg 6,288 × 3,359; 2.13 MB
-
 World- Cobalt Production, 1944* - DPLA - c1037ee27d2f7452509d5cade20dc8b9.jpg 6,320 × 3,323; 2.06 MB
-
 World- Copper Production, 1946 - DPLA - 1e25affd63262ebf6f714b859fa37ae6.jpg 6,312 × 3,357; 2.14 MB
-
 World- Molybdenum Production, *1946 - DPLA - bf84d1993965e3eb841cde8f2dbd4790.jpg 6,344 × 3,343; 2.13 MB
-

-
 World- Phosphate Rock Production, 1946 - DPLA - 91d47ae8aa4b189e36ea4bc9a4e3afdf.jpg 6,280 × 3,332; 2.12 MB
-
 World- Tin Production,* 1946 - DPLA - 677c4ed2e31b0634696bbc2508c3ce98.jpg 6,328 × 3,326; 2.06 MB
-
 World- Tungsten Concentrates Production* 1946 - DPLA - 04ff407662cdeca4cbc5abff7a92ce3f.jpg 6,328 × 3,324; 2.13 MB
-
 World- Vanadium Production,*1946 - DPLA - 3e24602f809408ce766ef8a40e07421c.jpg 6,296 × 3,360; 2.1 MB
-
 World- Zinc Production, 1946 - DPLA - 2f18a69219248aa357d5859b6d2cbe58.jpg 6,304 × 3,339; 2.12 MB
-
 World-Iron-Map.png 1,425 × 625; 31 KB
-
 World-Iron-Map3.png 1,425 × 625; 52 KB
-
 Worldwide meat production.pdf 1,195 × 889; 220 KB
-
 ZincMap.png 1,800 × 820; 132 KB
-
 The Harmsworth atlas and Gazetter 1908 (135852866).jpg 6,337 × 9,575; 56.37 MB
-
 The Harmsworth atlas and Gazetter 1908 (135852887).jpg 6,312 × 9,571; 55.63 MB
-
 The Harmsworth atlas and Gazetter 1908 (135852900).jpg 6,222 × 9,575; 55.11 MB
-
 The Harmsworth atlas and Gazetter 1908 (135852916).jpg 6,269 × 9,570; 52.4 MB
-
 The Harmsworth atlas and Gazetter 1908 (135852934).jpg 6,309 × 9,576; 54.98 MB
-
 The Harmsworth atlas and Gazetter 1908 (135852970).jpg 6,257 × 9,575; 52.84 MB
-
 The Harmsworth atlas and Gazetter 1908 (135852978).jpg 6,265 × 9,570; 52.67 MB
-
 The Harmsworth atlas and Gazetter 1908 (135852983).jpg 6,243 × 9,574; 50.88 MB
-
 The Harmsworth atlas and Gazetter 1908 (135852987).jpg 6,254 × 9,571; 55.29 MB
-
 The Harmsworth atlas and Gazetter 1908 (135852991).jpg 6,267 × 9,576; 50.31 MB
-
 The Harmsworth atlas and Gazetter 1908 (135852997).jpg 6,247 × 9,572; 53.95 MB
-
 The Harmsworth atlas and Gazetter 1908 (135852999).jpg 6,371 × 9,573; 53.25 MB
-
 The Harmsworth atlas and Gazetter 1908 (135853005).jpg 6,242 × 9,571; 50.36 MB
-
 The Harmsworth atlas and Gazetter 1908 (135853007).jpg 6,384 × 9,572; 52.71 MB


.PNG)
_(14594763908).jpg)
_(14758386396).jpg)
_(14801250363).jpg)


.png)

2.png)


_in_2017.png)


.png)


_2006.png)


.png)

.png)


.png)
.png)


.png)


.png)


.png)
.png)
.png)


_-_DPLA_-_a72a168c4edb6616752aa99ff0a338ea.jpg)


.jpg)
.jpg)
.jpg)
.jpg)
.jpg)
.jpg)
.jpg)
.jpg)
.jpg)
.jpg)
.jpg)
.jpg)
.jpg)
.jpg)