Category:Pollution maps
Jump to navigation
Jump to search
Subcategories
This category has the following 2 subcategories, out of 2 total.
A
M
Media in category "Pollution maps"
The following 33 files are in this category, out of 33 total.
-
 2013-tri-national-analysis-complete.pdf 1,275 × 1,650, 79 pages; 4 MB
-
 Air Pollution Earth.gif 320 × 243; 421 KB
-

-
 Carte du réseau de détecteurs luftdaten.png 898 × 863; 1 MB
-
 Ciudades mas contaminadas del mundo.png 1,408 × 1,008; 67 KB
-
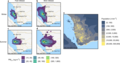
 Density-and-distribution-of-water-body-phosphate-harvested-stations.png 1,033 × 542; 1.03 MB
-
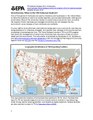
 Hazardous-waste-generated-per-capita.png 3,400 × 2,400; 833 KB
-
 Karte-Top-10-Blacksmith-Institute.png 1,600 × 868; 984 KB
-
 Light pollution europe.jpg 600 × 600; 85 KB
-

-

-
-
 Marine oil pollution map.png 1,425 × 625; 63 KB
-
 Mercury concentrations in surface sediment of Berry's Creek NJ.png 623 × 906; 1.06 MB
-
 Mercury pollution UE 22 2018 by EEA en.jpg 807 × 659; 109 KB
-
 Microbeads legislation world map.svg 1,035 × 531; 1.41 MB
-
 Midwestsmoke geos5 2023165.jpg 720 × 665; 373 KB
-
 Minamata map illustrating Chisso factory effluent routes2.png 670 × 580; 37 KB
-
 Mismanaged plastic waste, OWID.svg 850 × 600; 140 KB
-
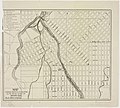
 Omaha Lead Site-map-EPA 2009.png 1,516 × 2,218; 1.51 MB
-
 Per capita mismanaged plastic waste, OWID.svg 850 × 600; 140 KB
-
 Per-capita-ocean-plastic-waste (OWID 0743).png 850 × 600; 109 KB
-
 PlasticrustMadeira.png 2,550 × 2,100; 639 KB
-
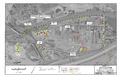 Raymark Contaminant Map 2016.png 5,100 × 3,300; 6.25 MB
-
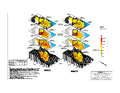 Raymark Groundwater Contaminant Contour Maps 2002-2009.png 2,200 × 1,700; 198 KB
-
 Raymark Superfund Site Map 2016.png 1,650 × 2,550; 5.22 MB
-
 Share of inadequately managed plastic waste (2010).svg 2,723 × 1,488; 1.51 MB
-
 Share-global-excess-nitrogen (OWID 1015).png 850 × 600; 121 KB
-
 Share-global-excess-phosphorous (OWID 1014).png 850 × 600; 117 KB
-
-
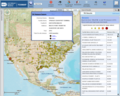 TriWiki.png 1,089 × 871; 1.02 MB
-
 US-PM25-nonattainment-2018-06.png 1,369 × 1,149; 191 KB
-
 Содержание Pb в почвах г. Лондона.jpg 1,071 × 751; 310 KB


.jpg)
.jpg)


.png)


.svg)
.png)
.png)


