Category:Nolan charts
Jump to navigation
Jump to search
political spectrum diagram | |||||
| Upload media | |||||
| Instance of | |||||
|---|---|---|---|---|---|
| Subclass of | |||||
| Named after | |||||
| |||||
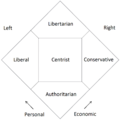
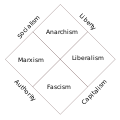
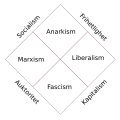
The Nolan Chart is a political diagram to illustrate the claim that libertarianism stands for both economic freedom and personal freedom, in contrast to left-wing "liberalism", which advocates only personal freedom, and right-wing "conservatism", which advocates only economic freedom.
Subcategories
This category has only the following subcategory.
V
Media in category "Nolan charts"
The following 35 files are in this category, out of 35 total.
-
2016 US election political spectrum.jpg 1,194 × 1,191; 109 KB
-
20201227 2345 - White Socialism.png 3,000 × 3,000; 9.35 MB
-
60-60 score.jpg 415 × 409; 60 KB
-
Chart political.png 450 × 450; 22 KB
-
COMUNITARISMO NOLAN.png 1,500 × 1,500; 286 KB
-
Diagrama de nolan.png 550 × 520; 61 KB
-
Mapa político.png 425 × 425; 40 KB
-
Nolan chart (Authoritarian highlighted).svg 1,000 × 1,000; 46 KB
-
Nolan chart (Centrist highlighted).svg 1,000 × 1,000; 46 KB
-
Nolan chart (Conservative highlighted).svg 1,000 × 1,000; 46 KB
-
Nolan chart (Libertarian highlighted).svg 1,000 × 1,000; 45 KB
-
Nolan chart (Progressive highlighted).svg 1,000 × 1,000; 46 KB
-
Nolan chart normal de liberales institut.svg 1,116 × 1,116; 19 KB
-
Nolan chart normal de unmodifiable.svg 1,116 × 1,116; 59 KB
-
Nolan chart normal de.svg 1,116 × 1,116; 20 KB
-
Nolan chart normal Persian.svg 1,116 × 1,116; 19 KB
-
Nolan chart normal-uk.svg 1,116 × 1,116; 19 KB
-
Nolan chart normal.png 1,194 × 1,191; 148 KB
-
Nolan chart normal.svg 1,116 × 1,116; 19 KB
-
Nolan chart-quiz.jpg 294 × 211; 138 KB
-
Nolan chart.svg 1,000 × 1,000; 42 KB
-
NolanwithNolanChart1996 (cropped).jpg 620 × 826; 241 KB
-
NolanwithNolanChart1996.jpg 1,155 × 1,299; 512 KB
-
Political Chart - Moderate Libertarian.JPG 414 × 284; 9 KB
-
Political Chart - Moderate Libertarianism.JPG 542 × 451; 24 KB
-
Political Chart - Moderate Libertarians.JPG 415 × 284; 9 KB
-
Political Chart-Moderate Libertarian.JPG 415 × 284; 9 KB
-
Political Chart-Moderate Libertarians.JPG 415 × 284; 10 KB
-
Politicalquad en.svg 768 × 768; 7 KB
-
Politicalquad es.svg 768 × 768; 3 KB
-
Politicalquad.svg 768 × 768; 7 KB
-
SLECO chart.png 800 × 600; 86 KB
-
Spectre politique français.png 800 × 600; 67 KB
-
Standard Nolan chart.jpg 1,194 × 1,191; 92 KB
-
קהילתנות - Communitarianism.png 1,500 × 1,500; 226 KB


