Category:Mikael Häggström/Medical diagrams
Jump to navigation
Jump to search

Subcategories
This category has the following 2 subcategories, out of 2 total.
Pages in category "Mikael Häggström/Medical diagrams"
The following 4 pages are in this category, out of 4 total.
Media in category "Mikael Häggström/Medical diagrams"
The following 172 files are in this category, out of 172 total.
-
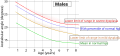
 Acetabular index by age in females.png 2,050 × 1,134; 215 KB
-
 Acetabular index by age in females.svg 1,537 × 850; 28 KB
-
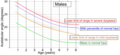 Acetabular index by age in males.png 2,070 × 956; 204 KB
-
 Acetabular index by age in males.svg 1,553 × 717; 32 KB
-
 Algorithm for kidney stone disease.png 883 × 1,378; 122 KB
-
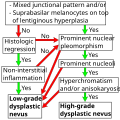
 Algorithm for low grade versus high grade dysplastic nevus.png 1,542 × 1,541; 241 KB
-
 Algorithm for low grade versus high grade dysplastic nevus.svg 771 × 770; 18 KB
-

-
 Aorta.svg 595 × 842; 6 KB
-
 Appendix locations.svg 1,479 × 1,283; 1.63 MB
-
 Appendix neoplasms by incidence and prognosis.png 1,570 × 739; 182 KB
-
 Appendix neoplasms by incidence and prognosis.svg 879 × 414; 14 KB
-
 Autosomal dominant inheritance for structural protein.png 1,148 × 1,929; 638 KB
-
 Autosomal recessive inheritance for affected enzyme.png 925 × 1,532; 454 KB
-
 BRCA1 and BRCA2 mutations and absolute cancer risk.jpg 5,945 × 3,705; 1.2 MB
-
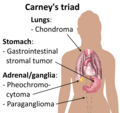 Carney's triad.png 1,205 × 1,131; 309 KB
-
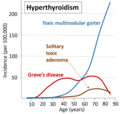 Causes of hyperthyroidism.png 805 × 763; 97 KB
-
 Cervical lymph nodes and levels.png 1,449 × 780; 542 KB
-
 Cervical lymph nodes and levels.svg 724 × 390; 315 KB
-
 Cervix quadrants and directions.svg 480 × 273; 44 KB
-
 Colon (anatomy).svg 595 × 842; 26 KB
-
 Contrast CT in low GFR.png 1,520 × 1,043; 129 KB
-
 Coronary arteries.svg 1,047 × 673; 291 KB
-
 Counting one or two signals on HER2 FISH.png 1,153 × 1,405; 200 KB
-
 Cysts and tumors in Von Hippel–Lindau disease.png 827 × 1,171; 989 KB
-
 Diagnostic algorithm of possible bacterial infection.png 5,376 × 4,133; 3.16 MB
-
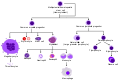
 Early B cell development.jpg 2,295 × 846; 251 KB
-
 Early B cell development.svg 2,151 × 793; 77 KB
-
 Edges and margins in intestinal tumor.png 1,195 × 1,190; 668 KB
-
 Edges and margins in intestinal tumor.svg 1,075 × 1,071; 202 KB
-
 Fibroid locations.jpg 1,401 × 857; 236 KB
-
 Finding the license of the picture in Wikipedia.png 492 × 416; 145 KB
-
 First and second wave of platelet aggregation.png 420 × 368; 32 KB
-
 Flow cytometric gating by side scatter and CD45, without labels.png 1,451 × 839; 365 KB
-
 Flow cytometric gating by side scatter and CD45.png 1,459 × 837; 389 KB
-
 Flow cytometric viability by 7-AAD.png 1,047 × 463; 73 KB
-
 Gallbladder polyp types by relative incidence.jpg 1,091 × 534; 74 KB
-
 Glass for pathologist.png 3,269 × 2,545; 2.41 MB
-
 Gross preparation of cervical cone.svg 1,381 × 585; 31 KB
-
 Gross processing of wedge-shaped skin excisions.svg 867 × 651; 428 KB
-
 Grossing of hemithyroidectomy.svg 49 × 84; 23 KB
-
 Grossing of thyroidectomy with isthmus.svg 95 × 94; 23 KB
-
 Grossing of thyroidectomy without isthmus.svg 79 × 91; 30 KB
-
 Hematopoiesis (human) diagram en.svg 1,405 × 1,092; 1.68 MB
-
 Hematopoiesis (human) diagram es.svg 1,416 × 1,096; 4.79 MB
-
 Hematopoiesis (human) diagram switch.svg 1,405 × 1,092; 1.33 MB
-
 Hematopoiesis simple.svg 1,800 × 1,200; 1.55 MB
-
 Hepatic artery.svg 595 × 842; 6 KB
-
 HER2 FISH algorithm.svg 1,257 × 587; 20 KB
-
 Hip-knee-ankle angle by age.png 2,413 × 1,509; 132 KB
-
 Hip-knee-ankle angle by age.svg 2,413 × 1,509; 35 KB
-
 How to not gross hemithyroidectomy.svg 61 × 84; 23 KB
-
 Human karyotype with bands and sub-bands (simple).png 13,837 × 22,488; 9.5 MB
-
 Human karyotype with bands and sub-bands (simple).svg 2,076 × 3,373; 6.68 MB
-
 Human karyotype with bands and sub-bands.pdf 3,000 × 4,800; 1.2 MB
-
 Human karyotype with bands and sub-bands.png 9,684 × 16,008; 9.58 MB
-
 Human karyotype with bands and sub-bands.svg 13,834 × 22,868; 7.82 MB
-
 IgG antibody.svg 183 × 136; 8 KB
-
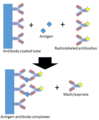 Immunoradiometric assay.png 558 × 676; 78 KB
-
 Incidences and prognoses of adrenal tumors.png 1,005 × 547; 75 KB
-
 Intramuscular site of adrenaline.jpg 2,075 × 2,755; 724 KB
-
 Liver tumor types in adults by relative incidence.png 615 × 335; 66 KB
-
 Liver tumor types in adults by relative incidence.svg 1,174 × 639; 12 KB
-
 Liver.svg 200 × 145; 6 KB
-
 Major topics of pathology informatics.png 1,905 × 3,570; 3.19 MB
-
 Morphologic patterns of podocyte injury.jpg 4,571 × 1,513; 1.7 MB
-
 Normal thromboelastography.png 1,459 × 557; 16 KB
-
 Nuclear-to-cytoplasm ratios.png 600 × 391; 34 KB
-
 Ovarian tumors by incidence and cancer risk.png 2,153 × 1,093; 341 KB
-
 Ovarian tumors by incidence and cancer risk.svg 1,309 × 665; 21 KB
-
 Papillae vs pseudopapillae.png 1,240 × 924; 305 KB
-
 Parts of a light microscope (english) - larger text.png 1,239 × 785; 239 KB
-
 Patholines menu.png 339 × 763; 369 KB
-
 Patholines menu.svg 647 × 1,456; 4.9 MB
-
 Perpendicular, en face and shaved slices.jpg 1,925 × 1,193; 311 KB
-
 Pie chart of causes of recurrent miscarriage.png 2,427 × 1,285; 1.07 MB
-
 Pie chart of colorectal carcinoma etiologies.svg 2,385 × 1,228; 13 KB
-
 Pie chart of colorectal polyp etiologies.png 2,417 × 1,651; 355 KB
-
 Pie chart of colorectal polyp etiologies.svg 1,208 × 826; 15 KB
-
 Pie chart of histopathologic types of invasive breast cancer.png 2,058 × 1,195; 290 KB
-
 Pie chart of histopathologic types of invasive breast cancer.svg 926 × 538; 18 KB
-
 Pie chart of incidence and malignancy of pigmented skin lesions.png 3,169 × 1,915; 749 KB
-
 Pie chart of incidence and malignancy of pigmented skin lesions.svg 1,584 × 958; 41 KB
-

-
 Pie chart of incidence and prognosis of histopathologic breast cancer types.png 2,795 × 1,220; 414 KB
-

-
 Pie chart of relative incidences of endometrial carcinoma-es.png 810 × 396; 91 KB
-
 Pie chart of relative incidences of endometrial carcinoma.png 1,363 × 667; 82 KB
-
 Pie chart of relative incidences of gastric polyps.png 1,041 × 653; 81 KB
-
 Pie chart of relative incidences of thyroid cancers.png 1,103 × 647; 100 KB
-
 Pie chart of relative incidences of Von Willebrand disease types.jpg 685 × 573; 56 KB
-
 Pie chart of stomach cancer types by relative incidence.png 733 × 649; 84 KB
-
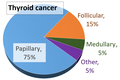 Pie chart of thyroid cancer types by incidence.png 941 × 631; 68 KB
-
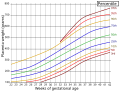 Placenta weight by gestational age.svg 1,119 × 854; 65 KB
-
 Postmortem interval changes (stages of death).png 5,077 × 1,377; 2.57 MB
-
 Pregnancy rate in ovulation induction.png 2,287 × 1,727; 224 KB
-
 Pregnancy rate in ovulation induction.svg 1,144 × 864; 17 KB
-
 Prenatal Down syndrome screening algorithm.png 2,177 × 1,125; 93 KB
-
 Prostate cancer types.png 2,814 × 1,636; 518 KB
-
 Prostate cancer types.svg 1,406 × 818; 17 KB
-
 Prostate cutting.png 1,498 × 951; 326 KB
-
 Prostate cutting.svg 749 × 475; 66 KB
-
 Prostate zones.png 1,231 × 754; 207 KB
-
 Prostate zones.svg 615 × 377; 46 KB
-
 Radioimmunoassay process.png 697 × 496; 72 KB
-
 Radiologist algorithm for pulmonary embolism.png 946 × 934; 109 KB
-
 Relative incidence of acute myeloid leukemia subtypes.png 1,181 × 683; 108 KB
-
 Relative incidence of colorectal cancers.svg 1,471 × 566; 40 KB
-
 Relative incidence of cutaneous cysts.jpg 1,172 × 816; 157 KB
-
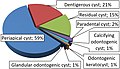 Relative incidence of odontogenic cysts.jpg 1,268 × 728; 182 KB
-
 Relative incidence of pancreatic neoplasms.png 1,270 × 653; 111 KB
-
 Relative incidence of parotid tumors.png 1,142 × 663; 78 KB
-
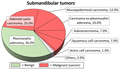 Relative incidence of submandibular tumors.png 1,160 × 671; 78 KB
-
 Relative incidences of glycogen storage diseases.png 1,219 × 609; 95 KB
-

-
 Relative incidences of ovarian cysts.jpg 1,327 × 565; 115 KB
-
 Relative incidences of testicular tumors.png 971 × 643; 86 KB
-
 Renal tumors by relative incidence and prognosis.png 1,894 × 1,013; 256 KB
-
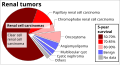 Renal tumors by relative incidence and prognosis.svg 1,217 × 651; 20 KB
-
 Rib cage anterior.svg 595 × 842; 43 KB
-
 Robertsonian translocation.png 2,048 × 2,048; 143 KB
-
 Sectioning of hemithyroidectomy.svg 53 × 84; 25 KB
-
 Sectioning of thyroidectomy with isthmus.svg 98 × 98; 32 KB
-
 Sectioning of thyroidectomy without isthmus.svg 78 × 90; 36 KB
-
 Serology interpretation of antibody panel for blood group antigens.jpg 1,356 × 652; 285 KB
-
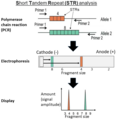 Short Tandem Repeat (STR) analysis.png 644 × 663; 78 KB
-
 Small intestinal cancers by incidence and prognosis.jpg 2,687 × 1,294; 543 KB
-
 Small intestinal cancers by incidence and prognosis.svg 1,727 × 832; 40 KB
-
 Small intestine.svg 595 × 842; 21 KB
-
 Swedish algorithm of deep vein thrombosis.png 1,102 × 606; 48 KB
-
 Symptoms and signs of tuberous sclerosis.png 2,539 × 2,252; 1.18 MB
-
 Symptoms and signs of tuberous sclerosis.svg 1,625 × 1,441; 1.79 MB
-
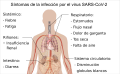
 Symptoms of coronavirus disease 2019 (cropped).png 1,879 × 993; 539 KB
-
 Symptoms of coronavirus disease 2019 in Arabic.png 1,546 × 1,171; 684 KB
-
 Symptoms of coronavirus disease 2019 in Hungarian.jpg 1,879 × 1,171; 336 KB
-
 Symptoms of coronavirus disease 2019 in Persian.jpg 1,390 × 974; 173 KB
-
 Symptoms of coronavirus disease 2019 in Simplified Chinese.svg 1,825 × 1,099; 879 KB
-
 Symptoms of coronavirus disease 2019 in Spanish.svg 2,363 × 1,465; 805 KB
-
 Symptoms of coronavirus disease 2019 in Traditional Chinese.svg 1,825 × 1,099; 881 KB
-
 Symptoms of coronavirus disease 2019 in Vietnamese.svg 2,363 × 1,465; 516 KB
-
 Symptoms of coronavirus disease 2019.png 1,879 × 1,171; 541 KB
-
 Symptoms of coronavirus disease 2019.svg 1,879 × 1,171; 874 KB
-
 Symptoms of neurofibromatosis type 1 - censored version.png 1,659 × 2,025; 2.57 MB
-
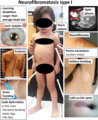
 Symptoms of neurofibromatosis type 1.png 1,659 × 2,025; 2.89 MB
-
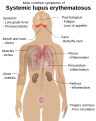 Symptoms of SLE.svg 1,252 × 1,566; 573 KB
-
 Thromboelastography in fibrinogen deficiency.png 1,457 × 379; 10 KB
-
 Thromboelastography in hemodilution or clotting factor deficiency.png 1,463 × 361; 11 KB
-
 Thromboelastography in low or dysfunctional platelets.png 1,459 × 347; 9 KB
-
 Thromboelastography in primary fibrinolysis.png 1,457 × 387; 15 KB
-
 Thromboelastography in secondary fibrinolysis.png 1,483 × 743; 27 KB
-
 Thromboelastography in thrombosis.png 1,457 × 721; 16 KB
-
 Thromboelastography parameters.png 2,048 × 1,017; 91 KB
-
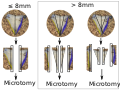
 Tissue selection from skin excision with 4-8 mm suspected malignant lesion.png 1,321 × 1,332; 810 KB
-
 Tissue selection from skin excision with 9-15 mm suspected malignant lesion.png 1,321 × 1,320; 765 KB
-
 Tissue selection from skin excision with diffuse lesion.png 1,350 × 1,280; 919 KB
-
 Tissue selection from skin excision with lesion 4-8 mm with benign appearance.png 1,321 × 1,327; 859 KB
-
 Tissue selection from skin excision with lesion 4-8 mm with benign appearance.svg 1,239 × 1,244; 2.4 MB
-
 Tissue selection from skin excision with lesion 9-15 mm with benign appearance.png 1,321 × 1,336; 866 KB
-
 Tissue selection from skin excision with lesion 9-15 mm with benign appearance.svg 1,239 × 1,252; 2.4 MB
-

-
 Tissue selection from skin excision with lesion less than 4 mm with benign appearance.svg 1,239 × 1,250; 2.38 MB
-
 Tissue selection from skin excision with less than 4 mm suspected malignant lesion.png 1,321 × 1,336; 913 KB
-
 Tissue selection from skin excision with narrow margin and lens shape.png 966 × 1,455; 568 KB
-
 Tissue selection from skin excision with narrow margin and oval shape.png 587 × 1,471; 448 KB
-
 Tissue selection from skin re-excisions.png 1,761 × 1,088; 592 KB
-
 Transformation zone types.png 1,519 × 583; 113 KB
-
 Transformation zone types.svg 912 × 350; 36 KB
-
 Transfusion reaction algorithm.jpg 929 × 751; 137 KB
-
 Uric acid crystals in polarized light.png 1,583 × 1,253; 93 KB
-
 Wedge-shaped skin excision.jpg 185 × 148; 15 KB
-
 Weight of heart versus body.jpg 2,207 × 1,029; 166 KB
-
 Weight of heart versus body.svg 1,103 × 514; 24 KB


.png)


.svg)


_diagram_en.svg)
_diagram_es.svg)
_diagram_switch.svg)


.png)
.svg)


_-_larger_text.png)


_analysis.png)


.png)


.png)