Category:Maps of metropolitan areas in South Africa
Jump to navigation
Jump to search
Media in category "Maps of metropolitan areas in South Africa"
The following 13 files are in this category, out of 13 total.
-
 Cape Town 2001 dominant language map.svg 814 × 966; 1.48 MB
-
 Cape Town 2001 dominant population group map.svg 814 × 966; 1.48 MB
-
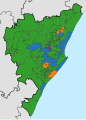
 Cape Town 2001 population density map.svg 814 × 966; 3.05 MB
-
 Cape Town 2011 dominant language map.svg 771 × 1,140; 299 KB
-
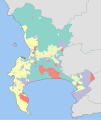
 Cape Town 2011 LGE PR result by ward.svg 623 × 923; 399 KB
-
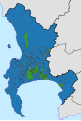
 Cape Town 2011 LGE ward winners.svg 623 × 923; 399 KB
-
 Cape Town 2016 LGE PR result by ward.svg 623 × 923; 635 KB
-
 Cape Town 2016 LGE ward winners.svg 623 × 923; 714 KB
-
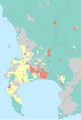
 EThekwini 2011 LGE PR result by ward.svg 643 × 893; 534 KB
-
 EThekwini 2011 LGE ward winners.svg 643 × 893; 534 KB
-
 Greater Johannesburg OpenStreetMap small Afrikaans.svg 496 × 325; 1.96 MB
-
 Greater Johannesburg OpenStreetMap small.svg 496 × 325; 1.95 MB
-
 ZA-GT-joburg.png 374 × 374; 58 KB


