Category:Information graphics of England
Jump to navigation
Jump to search
Subcategories
This category has the following 5 subcategories, out of 5 total.
C
E
I
M
Media in category "Information graphics of England"
The following 8 files are in this category, out of 8 total.
-
 A graph denoting the changing population of Bellerby over time.jpg 481 × 289; 34 KB
-
 Cholera deaths in England & Wales from May-November, 1849 Wellcome L0039177.jpg 3,600 × 4,878; 12.26 MB
-
 Diagram of cholera deaths in England during 1849 Wellcome L0039178.jpg 4,800 × 3,658; 11.86 MB
-
 Ethnic demographics of England from 1981 - 2021.gif 1,200 × 1,097; 391 KB
-
 London mortality; plague years & cholera years Wellcome L0039175.jpg 4,780 × 3,646; 9.27 MB
-
 Map of England showing prevalence of cholera, 1849 Wellcome L0039174.jpg 3,760 × 4,653; 9.8 MB
-
 Percentage of house type in area.png 481 × 289; 9 KB
-
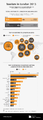 Tourism in London 2013.png 700 × 1,954; 163 KB


