Category:Graphics from the UNESCO Science Report, towards 2030, Chapter 9, European Union
Jump to navigation
Jump to search
Media in category "Graphics from the UNESCO Science Report, towards 2030, Chapter 9, European Union"
The following 16 files are in this category, out of 16 total.
-
-

-
 BERD as a share of GDP in the EU, 2005 and 2013.svg 501 × 357; 2.34 MB
-
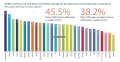
 Employment by R&D intensity, 2005 and 2013.svg 500 × 374; 1.75 MB
-

-

-
 Government debt to GDP ratio for selected EU countries, 2008–2013.svg 491 × 425; 2.03 MB
-
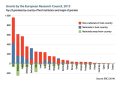 Grants by the European Research Council, 2013.svg 850 × 601; 42 KB
-
 Innovation performance of EU regions, 2004 and 2010.svg 482 × 298; 3.68 MB
-
 Publication performance in the European Union, 2008–2014.svg 595 × 842; 1.56 MB
-
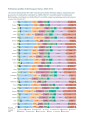 Publication profiles in the European Union, 2008–2014.svg 595 × 842; 2.18 MB
-
 Recession periods in the European Union, 2008–2014.svg 492 × 423; 2.56 MB
-
 Scientific publication trends in the European Union, 2005–2014.svg 595 × 1,553; 1.72 MB
-

-
 The Nordic EU members have the highest publication intensities.svg 595 × 235; 1.55 MB
-
 Uptake of STI activities by new EU member states, 2004–2013.svg 482 × 306; 3.33 MB


