Category:Graphics from the UNESCO Science Report, towards 2030, Chapter 22, India
Jump to navigation
Jump to search
Media in category "Graphics from the UNESCO Science Report, towards 2030, Chapter 22, India"
The following 20 files are in this category, out of 20 total.
-

-

-
 Changes in agricultural yields in India, 1980–2014.svg 646 × 383; 371 KB
-
 Exports of high-tech manufactured products from India, 2000–2013.svg 644 × 430; 180 KB
-
 Government outlay for India’s major science agencies, 2010.svg 307 × 403; 253 KB
-

-
 Growth of the Indian biotechnology industry, 2004–2014.svg 313 × 460; 189 KB
-

-
 Indian science, engineering and technology graduates, 2011 2012.svg 644 × 287; 205 KB
-
 India’s main industrial performers, 2010.svg 309 × 424; 172 KB
-
 R&D trends in Indian public and private enterprises, 2005–2011.svg 311 × 424; 189 KB
-

-

-

-
 Scientific publication trends in India, 2005–2014.svg 663 × 749; 386 KB
-
 Share of foreign companies performing R&D in India, 2001–2011.svg 315 × 373; 129 KB
-
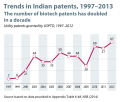
 Trends in Indian patents, 1997 2013.svg 663 × 979; 598 KB
-

-

-