Category:Graphics from the UNESCO Science Report, towards 2030, Chapter 19, East and Central Africa
Jump to navigation
Jump to search
Media in category "Graphics from the UNESCO Science Report, towards 2030, Chapter 19, East and Central Africa"
The following 15 files are in this category, out of 15 total.
-
 Breakdown of priority areas for Rwanda’s Economic Transformation to 2018.svg 313 × 409; 1.42 MB
-
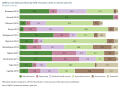
 Composition of GDP in sub-Saharan Africa by economic sector, 2013.svg 647 × 894; 1.04 MB
-
 GERD GDP ratio in East and Central Africa, 2013, or closest year.svg 315 × 295; 764 KB
-
 GERD in sub-Saharan Africa by field of science, 2012 or closest year.svg 646 × 475; 272 KB
-

-
 Science and engineering students in Cameroon and Ethiopia, 2010.svg 313 × 310; 141 KB
-
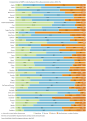
 Scientific publication trends in East and Central Africa, 2005 2014.svg 794 × 1,123; 2.07 MB
-

-

-

-

-
 Scientific publication trends in East and Central Africa, 2005–2014.svg 704 × 460; 1.57 MB
-
 Technology hubs in East and Central Africa, 2014.svg 640 × 564; 1.8 MB
-
 Top 12 crude oil-producing countries in Africa, 2014.svg 338 × 376; 587 KB
-
 Women researchers in sub-Saharan Africa, 2013 or closest year.svg 313 × 604; 332 KB


,_2013_or_closest_year.svg)


