Category:Graphics about tea
Jump to navigation
Jump to search
Subcategories
This category has the following 3 subcategories, out of 3 total.
M
T
Media in category "Graphics about tea"
The following 42 files are in this category, out of 42 total.
-
 2012 Tea production in Asia.svg 926 × 505; 66 KB
-
 Biétrix - Le Thé - Fig. 6.png 962 × 2,447; 728 KB
-
 Black tea class.PNG 364 × 239; 8 KB
-
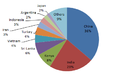
 Largest tea producing countries 2012-2013 - FAO.jpg 1,121 × 935; 113 KB
-

-

-
-

-

-

-

-
-
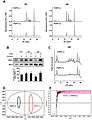
 Metabolomics-Driven-Nutraceutical-Evaluation-of-Diverse-Green-Tea-Cultivars-pone.0023426.s001.tif 1,984 × 2,526, 2 pages; 313 KB
-
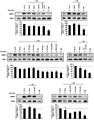
 Metabolomics-Driven-Nutraceutical-Evaluation-of-Diverse-Green-Tea-Cultivars-pone.0023426.s003.tif 1,972 × 2,529, 2 pages; 277 KB
-
-
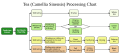
 Processus transformation 6 thés.png 1,829 × 695; 106 KB
-
 Production mondiale de thé en 2003.jpg 1,225 × 898; 79 KB
-
 Produkce caje ve svete 2003.PNG 800 × 586; 77 KB
-
 Spotreba caje.jpg 595 × 391; 30 KB
-
 Tea based beverage production in Japan.png 601 × 351; 25 KB
-
 Tea consumption per capita.svg 926 × 505; 30 KB
-
 Tea leaf icon.png 146 × 146; 8 KB
-
 Tea leaf Paradox Illustration.svg 213 × 167; 6 KB
-
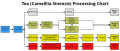
 Tea processing chart II.svg 650 × 300; 41 KB
-
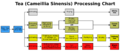 Tea processing chart.png 1,000 × 425; 70 KB
-
 Tea processing chart.svg 2,000 × 850; 28 KB
-
 Tea production in South Korea 1.svg 618 × 394; 36 KB
-
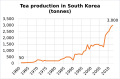 Tea production in South Korea.svg 618 × 405; 41 KB
-
 Tea-Production 2005 BMK.png 3,712 × 2,418; 45 KB
-
 Teaprocessing de.svg 1,255 × 663; 46 KB
-
 Teaprocessing-ar.png 2,000 × 1,030; 97 KB
-
 Teaprocessing-small.png 1,279 × 676; 74 KB
-
 Teaprocessing.svg 1,025 × 443; 46 KB
-
 TeaprocessingZh-small.png 1,280 × 676; 70 KB
-
 TeaprocessingZh.svg 1,052 × 744; 318 KB
-
 Tee Niveauausgleich.svg 1,052 × 744; 45 KB
-
 Tee Rühren.svg 1,052 × 744; 25 KB
-
 Teproduksjon statistikk.PNG 591 × 417; 77 KB
-
 Tie Guan Yin processing chart zh.GIF 614 × 374; 10 KB
-
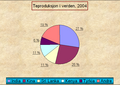
 World tea production, 2004.png 385 × 385; 7 KB
-
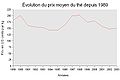 Évolution du prix moyen du thé depuis 1989.jpg 900 × 600; 52 KB
-
 お湯とお茶.jpg 1,932 × 1,500; 611 KB


