Category:Global marine plastic pollution statistics
Jump to navigation
Jump to search
Media in category "Global marine plastic pollution statistics"
The following 14 files are in this category, out of 14 total.
-

-
 Estimated global mass and count of floating plastics in the oceans from 1979 to 2019.png 2,256 × 2,453; 230 KB
-
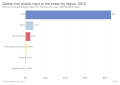 Global river plastic input to the ocean by region, OWID.svg 850 × 600; 5 KB
-
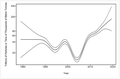 Global trend of marine plastic pollution from 1979 to 2019.png 1,250 × 827; 139 KB
-
 Macroplastics in the surface ocean, OWID.svg 850 × 600; 20 KB
-
-
 Menge an Plastikmuell in den Weltmeeren 2018.svg 600 × 400; 264 KB
-
 Microplastics in the surface ocean, OWID.svg 850 × 600; 20 KB
-
 Mismanaged plastic waste vs. coastal population, OWID.svg 850 × 600; 36 KB
-
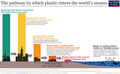 Pathway-of-plastic-to-ocean.png 3,326 × 2,043; 346 KB
-
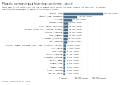 Plastic ocean input from top 20 rivers, OWID.svg 850 × 600; 14 KB
-
 Plastic waste generated by coastal populations, OWID.svg 850 × 600; 141 KB
-
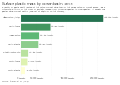 Surface plastic mass by ocean basin, OWID.svg 850 × 600; 7 KB
-
 Surface plastic particles by ocean basin, OWID.svg 850 × 600; 6 KB


