Category:GDP maps of England
Jump to navigation
Jump to search
Media in category "GDP maps of England"
The following 27 files are in this category, out of 27 total.
-
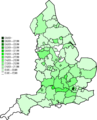 Map of NUTS 3 areas in England by GVA per capita (1995).png 2,121 × 2,629; 592 KB
-
 Map of NUTS 3 areas in England by GVA per capita (1995).svg 2,121 × 2,629; 243 KB
-
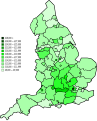
 Map of NUTS 3 areas in England by GVA per capita (1996).png 2,121 × 2,629; 592 KB
-
 Map of NUTS 3 areas in England by GVA per capita (1996).svg 2,121 × 2,629; 243 KB
-
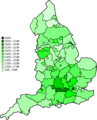
 Map of NUTS 3 areas in England by GVA per capita (1997).png 2,121 × 2,629; 591 KB
-
 Map of NUTS 3 areas in England by GVA per capita (1997).svg 2,121 × 2,629; 243 KB
-
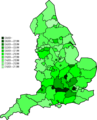
 Map of NUTS 3 areas in England by GVA per capita (1998).png 2,121 × 2,629; 587 KB
-
 Map of NUTS 3 areas in England by GVA per capita (1998).svg 2,121 × 2,629; 243 KB
-
 Map of NUTS 3 areas in England by GVA per capita (1999).png 2,121 × 2,629; 578 KB
-
 Map of NUTS 3 areas in England by GVA per capita (1999).svg 2,121 × 2,629; 243 KB
-
 Map of NUTS 3 areas in England by GVA per capita (2000).png 2,121 × 2,629; 576 KB
-
 Map of NUTS 3 areas in England by GVA per capita (2000).svg 2,121 × 2,629; 243 KB
-
 Map of NUTS 3 areas in England by GVA per capita (2001).png 2,121 × 2,629; 568 KB
-
 Map of NUTS 3 areas in England by GVA per capita (2001).svg 2,121 × 2,629; 243 KB
-
 Map of NUTS 3 areas in England by GVA per capita (2002).png 2,121 × 2,629; 563 KB
-
 Map of NUTS 3 areas in England by GVA per capita (2002).svg 2,121 × 2,629; 243 KB
-
 Map of NUTS 3 areas in England by GVA per capita (2003).png 2,121 × 2,629; 553 KB
-
 Map of NUTS 3 areas in England by GVA per capita (2003).svg 2,121 × 2,629; 242 KB
-
 Map of NUTS 3 areas in England by GVA per capita (2004).png 2,121 × 2,629; 543 KB
-
 Map of NUTS 3 areas in England by GVA per capita (2004).svg 2,121 × 2,629; 242 KB
-
 Map of NUTS 3 areas in England by GVA per capita (2005).png 2,121 × 2,629; 534 KB
-
 Map of NUTS 3 areas in England by GVA per capita (2005).svg 2,121 × 2,629; 239 KB
-
 Map of NUTS 3 areas in England by GVA per capita (2006).png 2,121 × 2,629; 523 KB
-
 Map of NUTS 3 areas in England by GVA per capita (2006).svg 2,121 × 2,629; 246 KB
-
 Map of NUTS 3 areas in England by GVA per capita (2007).png 2,121 × 2,629; 514 KB
-
 Map of NUTS 3 areas in England by GVA per capita (2007).svg 2,121 × 2,629; 246 KB
-
 GVA of ceremonial counties in England (2007).svg 1,200 × 1,385; 119 KB
.png)
.svg)
.png)
.svg)
.png)
.svg)
.png)
.svg)
.png)
.svg)
.png)
.svg)
.png)
.svg)
.png)
.svg)
.png)
.svg)
.png)
.svg)
.png)
.svg)
.png)
.svg)
.png)
.svg)
.svg)