Category:Female labour statistics
Jump to navigation
Jump to search
Subcategories
This category has only the following subcategory.
Media in category "Female labour statistics"
The following 53 files are in this category, out of 53 total.
-
 2011 females occupation.jpg 480 × 289; 27 KB
-

-

-
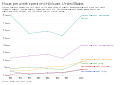
 Average hourly earnings of male and female employees, OWID.svg 850 × 600; 8 KB
-

-
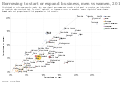 Borrowing to start or expand business, men vs women, OWID.svg 850 × 600; 33 KB
-
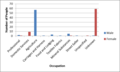
 Employed civilians by occupation and sex - 2007.png 928 × 686; 47 KB
-
 Female labor force by age, OWID.svg 850 × 600; 12 KB
-
-

-
 Female labor force participation rates, 2016 vs 1980, OWID.svg 850 × 600; 32 KB
-
 Female labor force participation rates, OWID.svg 850 × 600; 8 KB
-
 Female share of employment in senior and middle management (%), OWID.svg 850 × 600; 139 KB
-
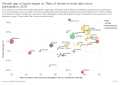
 Fertility and female labor force participation, OWID.svg 850 × 600; 100 KB
-
-
 Hours per week spent in leisure, by sex, United States, OWID.svg 850 × 600; 8 KB
-
 Hours per week spent on child care, United States, OWID.svg 850 × 600; 9 KB
-

-

-

-

-

-
 Occupation data (1881).jpg 480 × 289; 26 KB
-
 Occupation Graph Parham -1881.jpg 527 × 356; 39 KB
-
 Occupation of Males and Females in 1881 , Layer Breton .png 481 × 288; 9 KB
-
 Occupation of males and females in Langdon in 1881..jpg 650 × 400; 43 KB
-
 Occupation of the Residents of Winwick in 1881.png 752 × 453; 44 KB
-
 Occupation of the Residents of Winwick, 2011.jpg 752 × 452; 36 KB
-
 Occupation Structure concerning 1881 Census.png 481 × 289; 9 KB
-
 Occupation Structure.png 481 × 289; 10 KB
-

-
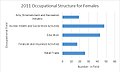
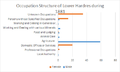
 Occupational Structure for females in Ramsden Crays 1881.png 691 × 865; 67 KB
-
 Occupational structure for females in Ramsden Crays 2011.png 588 × 491; 32 KB
-
 Occupational structure in Sutton, 1881.jpg 480 × 318; 31 KB
-
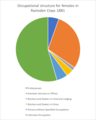
 Occupational Structure of Females in 1881.jpg 659 × 460; 48 KB
-
 Occupations for Males and Females in 2011.jpg 361 × 217; 20 KB
-
 Occupations of Females in 2011.jpg 360 × 217; 20 KB
-
 Occupations of males and females in 1881 in Beighton.png 1,323 × 860; 91 KB
-
 Occupations of Males and Females in Hunton 1881.jpg 900 × 284; 43 KB
-
 Occupations of men and women in Moor Crichel in 1881.jpg 666 × 475; 66 KB
-
 Occupations of Newborough 2011.png 1,040 × 625; 76 KB
-
 Occupations of Newborough in 1881.png 1,053 × 644; 56 KB
-
 Percentage of firms with a top female manager, OWID.svg 850 × 600; 141 KB
-
 Proportion of labor force who are women, OWID.svg 850 × 600; 140 KB
-
 Proportion of women in senior and middle management positions, OWID.svg 850 × 600; 140 KB
-
 Proportion of women participating in the labor force, OWID.svg 850 × 600; 32 KB
-
 Ratio of female to male labor force participation rates (%), OWID.svg 850 × 600; 142 KB
-
 Ratio of female to male labor force participation rates, OWID.svg 850 × 600; 24 KB
-
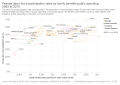
 Ratio of female-to-male median earnings by age, US, OWID.svg 850 × 600; 11 KB
-
 Share of people who prefer a male vs a female boss, OWID.svg 850 × 600; 6 KB
-
 Unemployment rate of males vs. females, OWID.svg 850 × 600; 44 KB
-

-
 Women in workforce.png 1,080 × 551; 277 KB


,_OWID.svg)


,_OWID.svg)


_(modeled_ILO_estimate)_vs._GDP_per_capita,_OWID.svg)


.jpg)


,_OWID.svg)


