Category:Diagrams of sea ice
Jump to navigation
Jump to search
Media in category "Diagrams of sea ice"
The following 22 files are in this category, out of 22 total.
-
 2012 Arctic Ice Extent-aug25.png 1,050 × 840; 456 KB
-
 2019 MPAS sea ice grid.tif 1,153 × 984; 4.33 MB
-
 AMSRE Sea Ice Extent.png 720 × 450; 100 KB
-
 Antarctic extent 1978-2007.png 504 × 360; 16 KB
-
 Antarctic sea ice extent 6 July 2014.png 1,050 × 840; 251 KB
-
 Arctic Extent 1978-2007.png 504 × 360; 13 KB
-
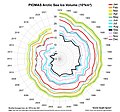
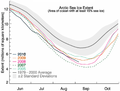
 Arctic sea ice decline 2015 May NSIDC.png 3,300 × 2,550; 326 KB
-
 Arctic sea ice reaches lowest maximum extent on record.png 1,050 × 840; 329 KB
-
 Arctic-death-spiral.jpg 1,024 × 960; 258 KB
-
 Arctic-death-spiral.png 1,024 × 960; 713 KB
-
 Brine salinity.gif 1,350 × 975; 10 KB
-
 Brine volume.gif 1,350 × 975; 14 KB
-
 BRINICLE FORMATION nixsyt.gif 1,300 × 1,050; 100 KB
-
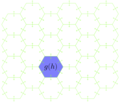
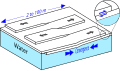 Drawing of rafted ice.svg 298 × 174; 26 KB
-
 Eick svsd.png 1,350 × 975; 36 KB
-
 ETH-BIB-Meerwasser (Salzgehalt, Dichte, Gefrierpunkt)-Dia 247-Z-00407.tif 3,509 × 2,877; 28.98 MB
-
 Extension de la banquise.png 844 × 638; 152 KB
-
 False bottom coverage at the surface plot of sea ice draft.png 3,600 × 1,500; 1.28 MB
-
 False bottom salinity.png 1,860 × 1,320; 123 KB
-
 False bottom sonar.png 3,600 × 1,500; 1.29 MB
-
 False bottom temperature.png 1,860 × 1,320; 120 KB
-
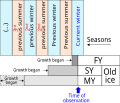 FYvsSYvsMY.svg 538 × 458; 34 KB


